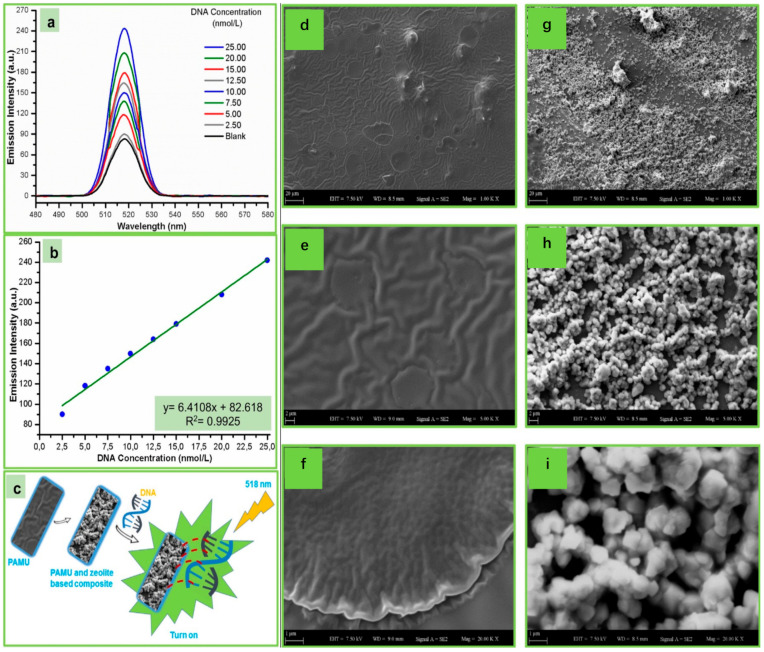
Figure 22.
(a) Optical spectrum results of zeolite-based composite under the different DNA concentrations conditions, (b) linear relationship between DNA concentrations and fluorescence intensity difference above the optimal conditions and (c) schematic representation for the proposed biosensor. SEM images of PAMU (d–f) and zeolite-based composite (g–i). Reprinted with permission from Spectrochimica Acta Part A: Molecular and Biomolecular Spectroscopy, Copyright 2019, Elsevier [152].

