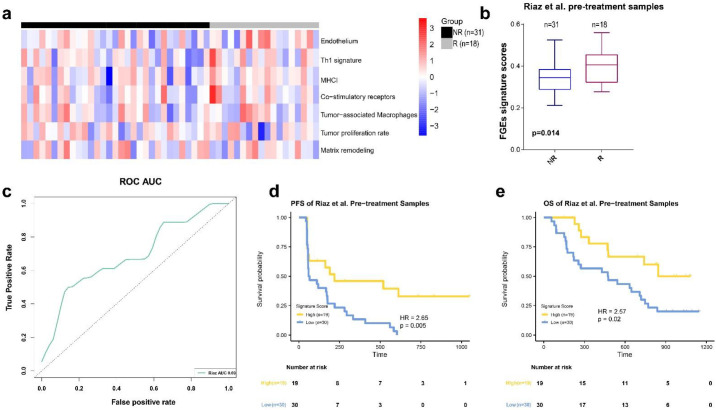
Figure 2.
FGE-based signature for pretreatment samples (FGE-PRE). (a) Heatmap representing the single sample gene set enrichment analysis value of pretreatment nonresponders (NR) and responders (R) in the Riaz et al. cohort. (b) Boxplot of FGE-PRE signature scores for pretreatment samples from the Riaz et al. datasets. p values were computed via a one-sided Wilcoxon rank-sum test. (c) Receiver operating correlation curve and area under the curve of FGE-PRE signatures for pretreatment samples from the Riaz et al. cohort. (d,e) Kaplan–Meier curves of PFS and overall survival for pretreatment samples based on FGE-PRE signature scores for the Riaz et al. cohort.

