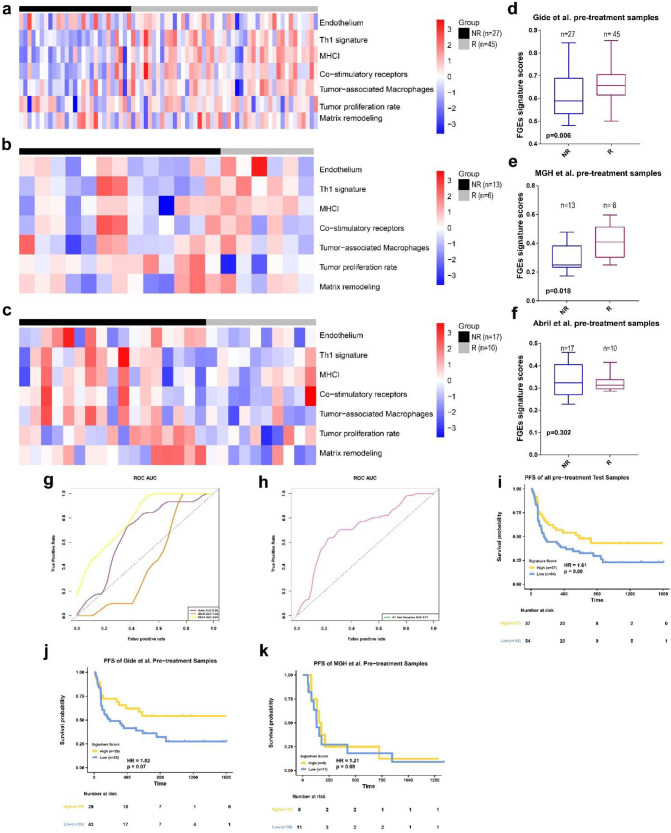
Figure 3.
FGE-based signature for pretreatment samples (FGE-PRE) (a–c) Heatmap representing the single sample gene set enrichment analysis value of pretreatment nonresponders (NR) and responders (R) in the Gide et al., MGH, and Abril-Rodriguez et al. cohorts. (d–f) Boxplot of FGE-PRE signature scores for pretreatment samples from the Gide et al., MGH, and Abril-Rodriguez et al. cohorts. p values were computed via a one-sided Wilcoxon rank-sum test. (g) Receiver operating correlation curve and area under the curve of FGE-PRE signatures for pretreatment samples from the Gide et al., MGH, and Abril-Rodriguez et al. cohorts. (h) Receiver operating correlation curve and area under the curve of FGE-PRE signatures for pretreatment samples from all test samples combined. (i–k) Kaplan–Meier curves of PFS for pretreatment samples based on FGE-PRE signature scores for all test samples, Gide et al., and MGH cohorts.

