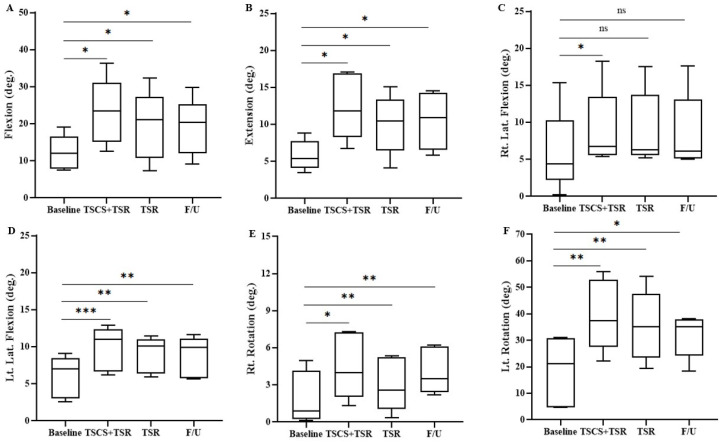
Figure 6.
The trunk range of motion measured with Vicon for each participant during the study. Statistical analysis was conducted between the baseline with TSCS+TSR, TSR and follow-up. (A) Flexion, (B) extension, (C) right lateral flexion, (D) left lateral flexion, (E) right rotation, and (F) left rotation, respectively. TSCS, transcutaneous electrical spinal cord stimulation; TSR, task-specific rehabilitation; F/U, follow-up; * p < 0.05, ** p < 0.01, *** p < 0.001, non-significant (ns) p > 0.05, all in comparison to the baseline value.

