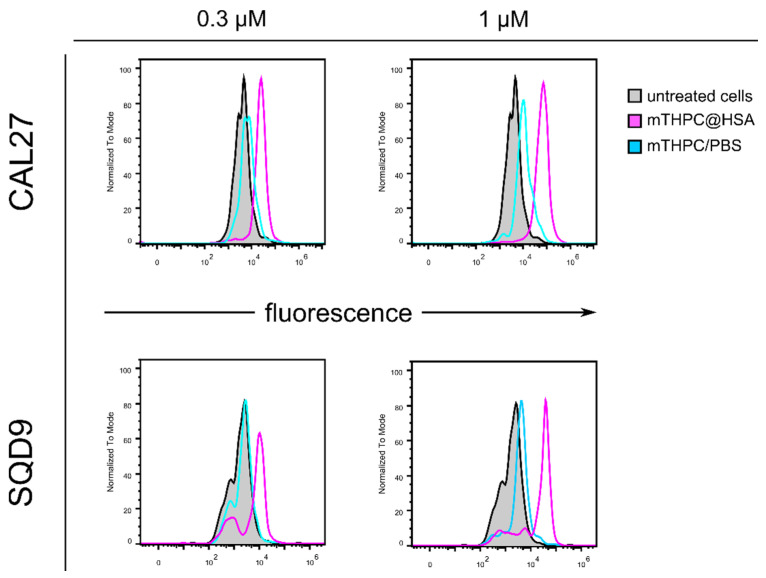
Figure 7.
Flow cytometry analysis of the intracellular uptake of mTHPC@HSA (in magenta) and mTHPC/PBS (in cyan) after 45 min of incubation of CAL27 and SQD9 cells with increasing concentration of the complexes (0.3 and 1 µM) compared to untreated cells (in dark filled in grey). All data were normalized to mode.

