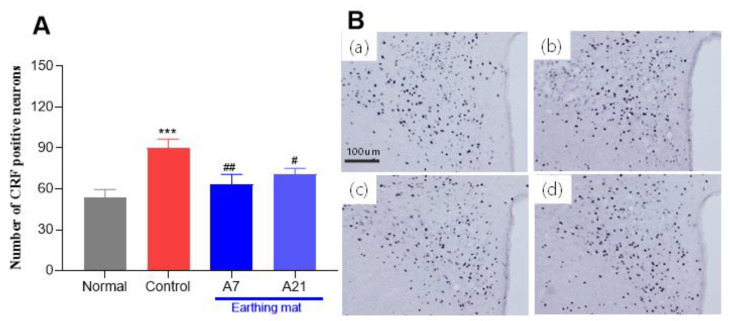
Figure 5.
(A) Effect of earthing mat on CRF expression. (A) Data represent means ± SEM. *** < 0.001 compared to Normal group, # p < 0.05, ## p < 0.01 compared to Control group. (B) Photographs showing the distribution of CRF immunoreactive cells in the PVN of the (a) Normal group, (b) Control group, (c) A7 group, (d) A21 group. Coronal sections were 30 μm thick, and the scale bar represents 100 μm.

