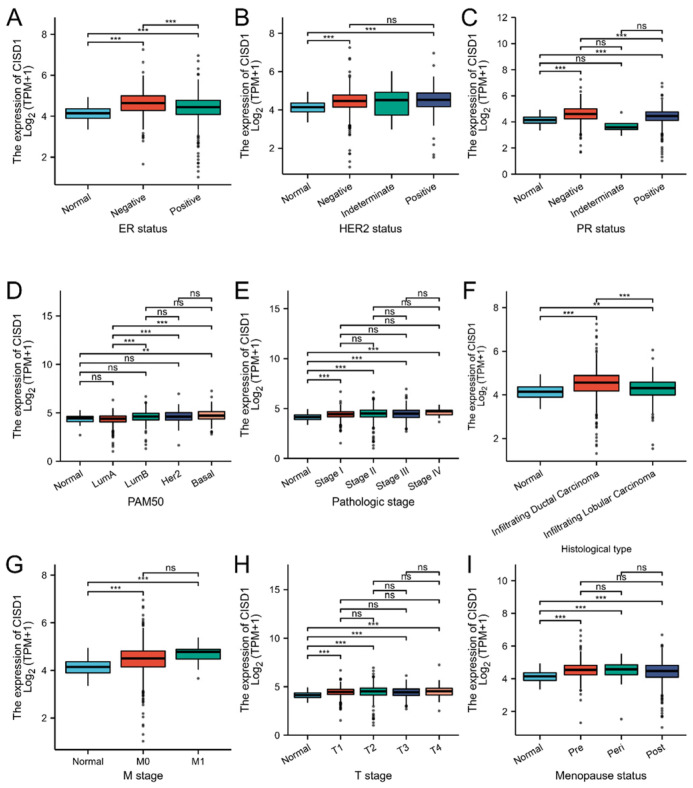
Figure 2.
Correlation between the clinical features and CISD1 expression. Boxplots represented correlation between the CISD1 expression and ER status (A), HER2 status (B), PR status (C), PAM50 (D), pathologic stage (E), histological type (F), M stage (G), T stage (H), Menopause status (I). “ns”, “**”, and “***” represented no significance, p-values < 0.01, and 0.001, respectively.

