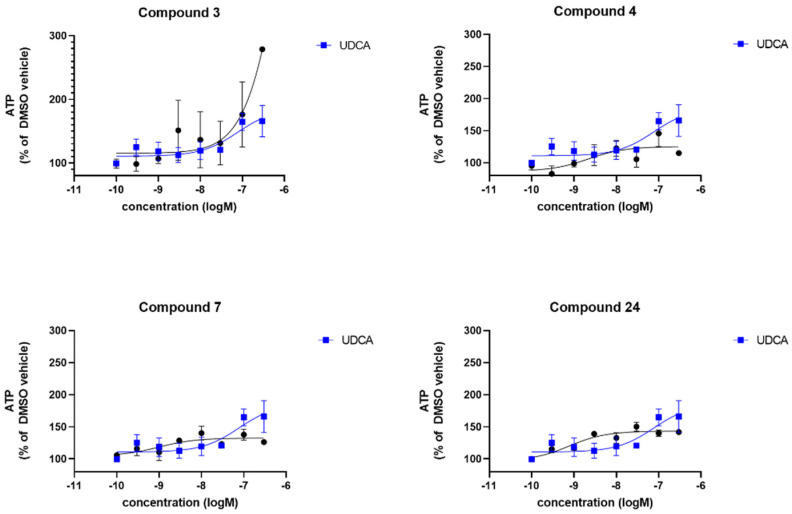
Figure 3.
Evaluation of the total cellular ATP levels. Data are shown for 3 sPD fibroblast lines, each performed on 3 independent passages and subsequently combined to show the compound effect across multiple fibroblast lines. Fibroblasts show increased cellular ATP levels after 24 h treatment with UDCA, 3, 4, 7 and 24 albeit to varying extents. Data are shown as mean with error bars representing SEM. Nonlinear regression line is plotted using the equation log(agonist) vs. response (3 parameters).

