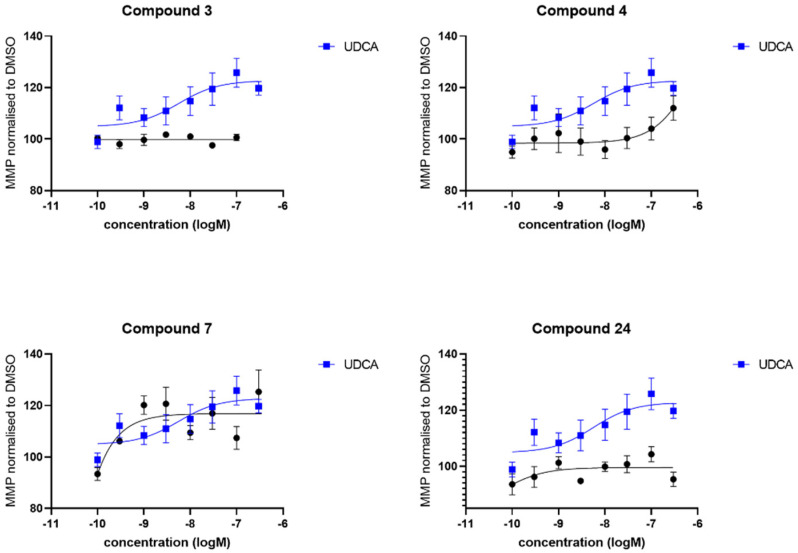
Figure 5.
Evaluation of the mitochondrial membrane potential. Data are shown for 3 sPD fibroblast lines, each performed on 3 independent passages and subsequently combined to show the compound effect across multiple fibroblast lines. Fibroblasts show an increased mitochondrial membrane potential after 24 h treatment with UDCA, 4 and 7 albeit to varying extents. Treatment with 3 and 24 did not show any improvement in mitochondrial membrane potential in any sPD fibroblast line. Data are shown as mean with error bars representing SEM. Nonlinear regression line is plotted using the equation log(agonist) vs. response (3 parameters).

