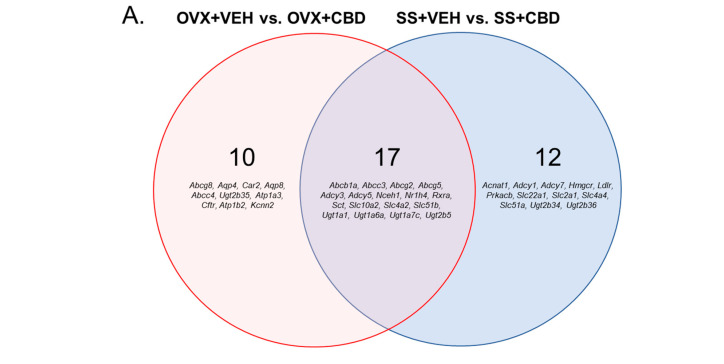
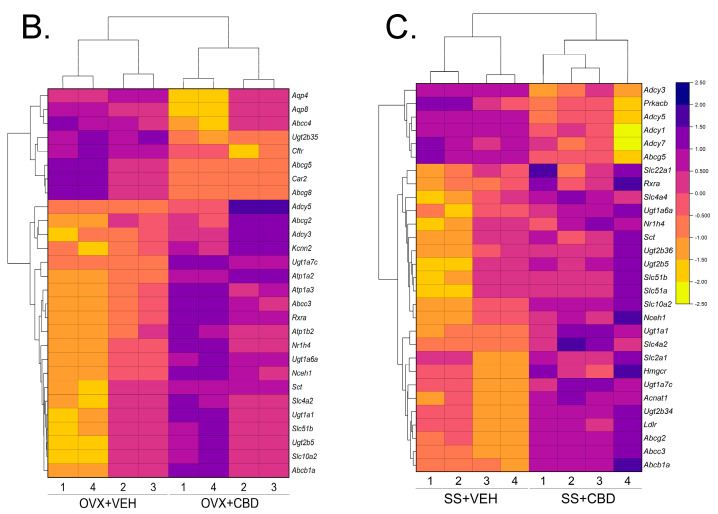
Figure 2.
Differentially expressed bile secretion genes. (A) Venn diagram showing DEGs for indicated comparisons as well as DEGs that are in common between comparisons. DEGs held in common do not necessarily indicate the same direction of change. DEGs for (B) OVX+VEH vs. OVX+CBD and (C) SS+VEH vs. SS+CBD were generated based on Euclidean clustering. The Z-score scale indicates downregulated genes from 0 to −2.5 (orange to yellow shades) and upregulated genes from 0 to 2.5 (red to purple/navy shades).


