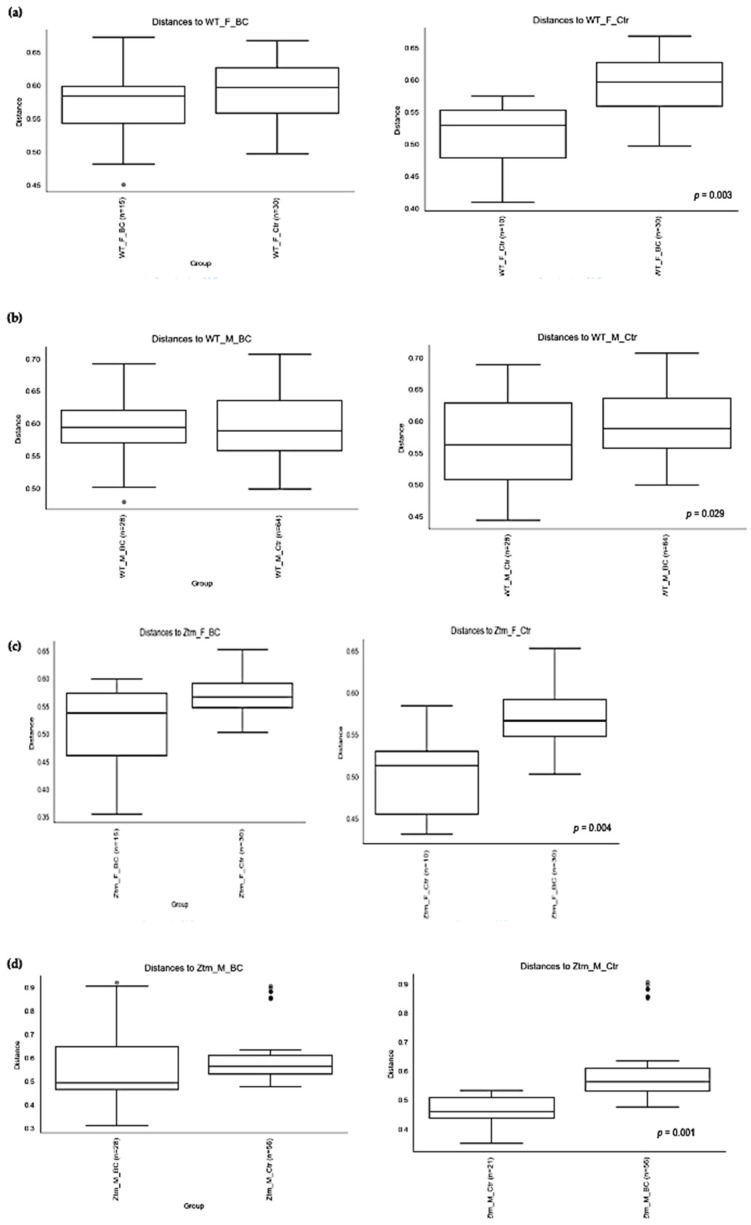
Figure 4.
Beta diversity of the intestinal microbial communities between WT f BC and WT f control groups (a), WT m BC and WT m control groups (b), Ztm f BC and Ztm f control groups (c), and Ztm m BC and Ztm m control groups. (d) Box plot showing Jaccard distance between groups and within groups, p < 0.05 indicating beta diversity between groups is significant. BC = bovine colostrum treatment; Ctr = control mice; WT = wild-type mice; Ztm = zonulin transgenic mice; f = female; m = male; n = number of mice in a group. p = pairwise PERMANOVA results.

