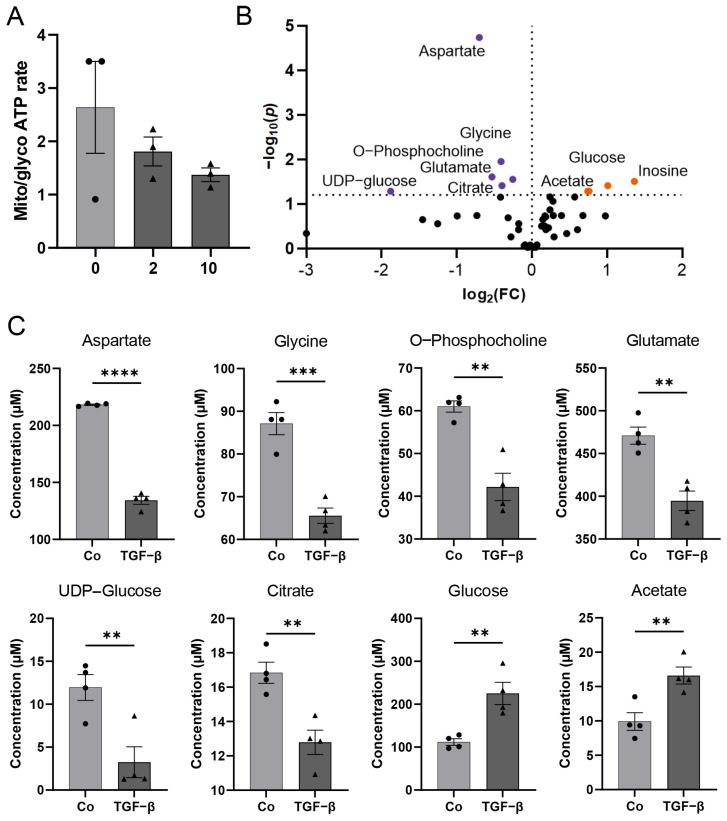
Figure 4.
Metabolomics analysis of HBVP upon TGF-β treatment. (A) Determination of mitochondrial to glycolytic ATP production at different TGF-β concentrations using respiratory analysis. HBVP were treated with TGF-β (2 or 10 ng/mL, dark grey bars; black triangles) for 16 h or were left untreated (0; light grey bar; black dots; n = 3, each 6 technical replicates, SEM). (B) Volcano plot visualizing most significant metabolite concentration increase (orange dots) and decrease (purple dots) upon TGF-β treatment compared to control for p < 0.05, false discovery rate (FDR)-corrected data with fold change (FC) threshold >1.2 (n = 4). (C) Bar plots with individual replicate points and SEM of the most significant metabolite changes upon TGF-β treatment (each 5 ng/mL of TGF-β1 plus β2; black triangles) (n = 4): aspartate, glycine, O-phosphocholine, glutamate, UDP-glucose, and citrate concentrations were decreased compared to control (black dots), while glucose and acetate concentrations increased upon TGF-β treatment, based on parametric, unpaired t-test, ** p < 0.01, *** p < 0.001, **** p < 0.0001. Grey bar and circles present controls, dark grey bars and squares present the TGF-β treatment.

