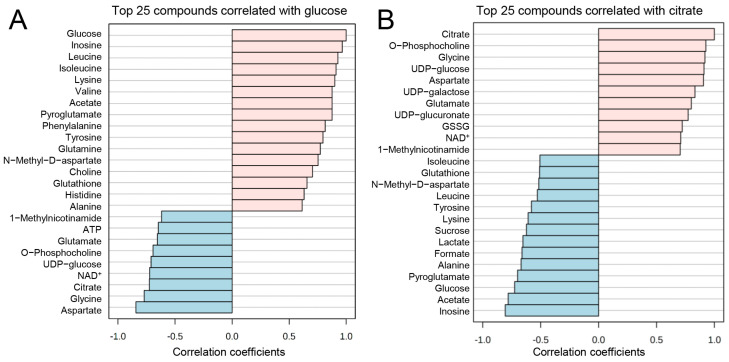
Figure 5.
Pattern hunter analysis of glucose and citrate. (A) Glucose concentration pattern changes positively correlate (pink bars) with inosine, leucine, isoleucine, lysine, valine, acetate, pyroglutamate, phenylalanine, tyrosine, glutamine, N-methyl-D-aspartate, choline, glutathione, histidine, and alanine, while negatively correlate (blue bars) with aspartate, glycine, citrate, nicotinamide adenine dinucleotide (NAD)+, uridine diphosphate (UDP)-glucose, O-phosphocholine, glutamate, adenosine triphosphate (ATP) and 1-methylnicotinamide. (B) Citrate positively (pinks bars) correlates with O-phosphocholine, glycine, UDP-glucose, aspartate, UDP-galactose, UDP-glucuronate, oxidized glutathione (GSSG), NAD+, and 1-methylnicotinamide; and negatively (blue bars) correlates with inosine, acetate, glucose, pyroglutamate, alanine, formate, lactate, sucrose, lysine, tyrosine, leucine, N-methyl-D-aspartate, glutathione, and isoleucine concentration patterns, based on Pearson r distance measure (n = 4, two-group comparison).

