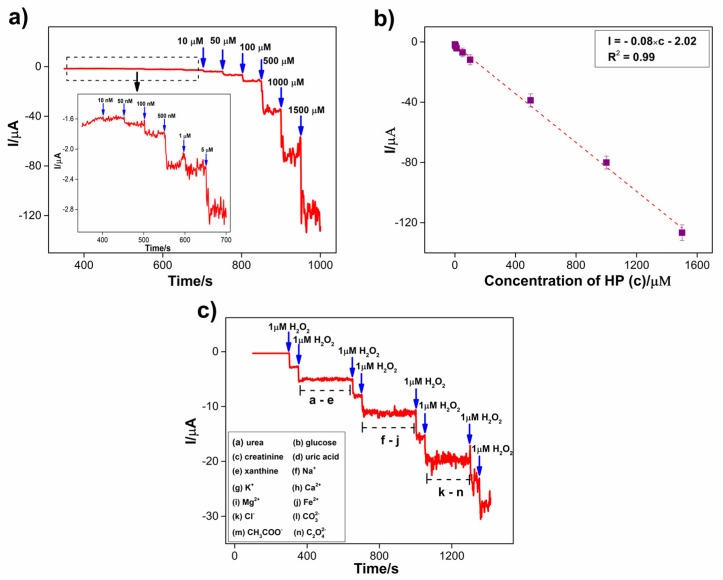
Figure 11.
Amperometric i-t curve obtained for the reduction of H2O2 at Co3S4/GCNNS in 0.2 M PBS (pH 7.2) at an applied potential of −0.7 V for (a) an addition of H2O2 of concentration from 10 nM to 1.5 mM, (b) calibration plot of current vs. concentration of H2O2, (c) for the reduction of 1 µM H2O2 in presence of 500 µM of potential interferences.

