Figure 3.
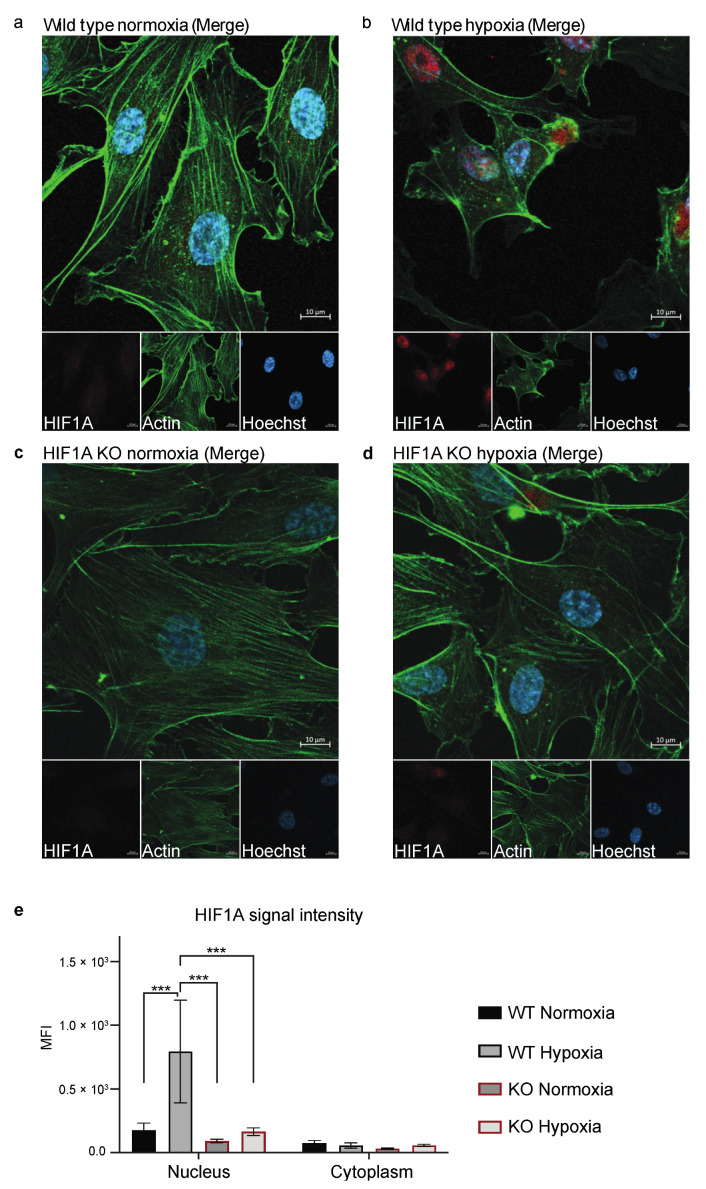
Staining of HIF1A in HIF1A KO and WT HUVECs. (a–d) One representative image of the stained HIF1A KO and WT HUVECs, which were stained with Hoechst (blue), anti-actin (green), and anti-HIF1A (red). (a) WT HUVECs cultured in normoxic conditions. (b) WT HUVECs cultured in hypoxic conditions. (c) HIF1A KO HUVECs cultured in normoxic conditions. (d) HIF1A KO HUVECs cultured in hypoxic conditions. (e) Quantification of the HIF1A signal intensity (MFI) in the nucleus and the cytoplasm in WT and KO HUVECs in normoxic and hypoxic conditions, which is compared by two-way ANOVA multiple comparisons test, *** p ≤ 0.001. The experiment was performed with one biological replicate at p. 3 (n = 3) and five images were taken per well. Scale bar 10 µm.

