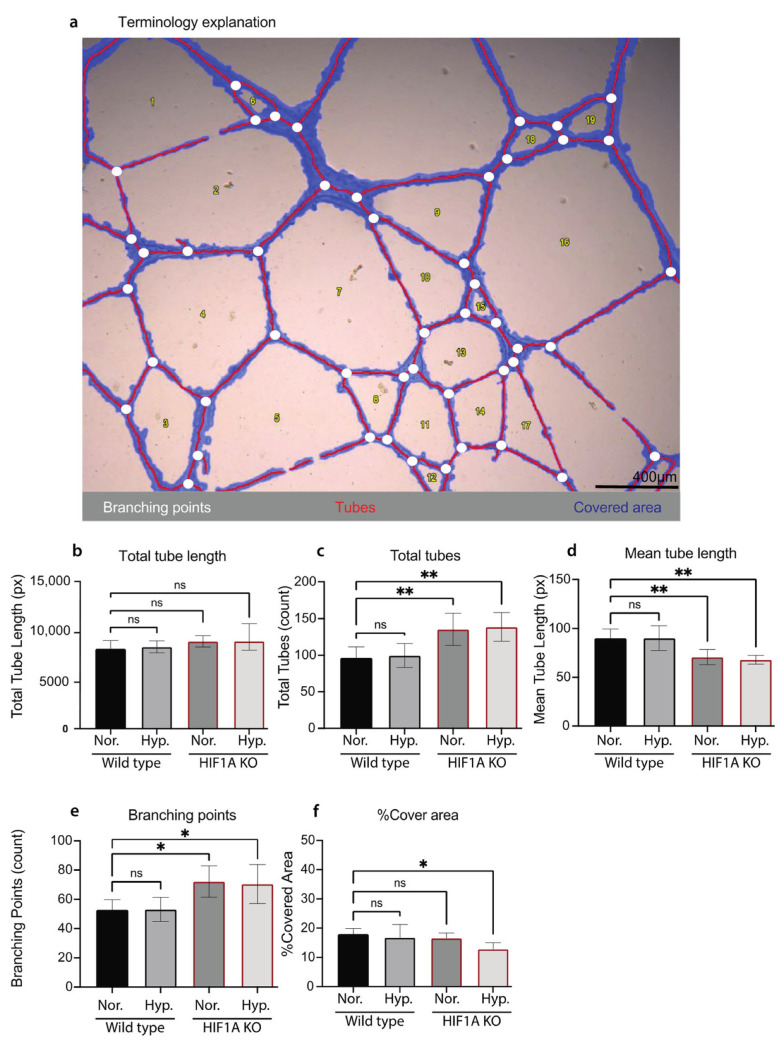
Figure 4.
Quantification of the tube formation assay of HIF1A KO and WT HUVECs. (a) One representative bright field image of the TFA HUVECs, visualizing the Wimasis terminology which illustrates the tubes in red, the branching points in white, and the covered area in blue. Scale bar 400 µm. (b–f) Quantification of the TFA analysis of HIF1A KO and WT HUVECs cultured in normoxic conditions (Nor.) or 2 h hypoxic conditions (Hyp.). (b) The total tube length calculated in pixels. (c) The total amount of tubes, (count). (d) The mean tube length, (pixels). (e) Shows the total branching points, (count). (f) The percentage of covered area. The mean of each test ± STD is plotted, and one-way ANOVA with Tukey multiple comparisons test compared each sample group to the WT HUVECs cultured in normoxic conditions (ns = no significance, * p ≤ 0.05, and ** p ≤ 0.01). (a–f): Experiments on HUVECs from one biological donor at final p. 3.

