
Figure 2.
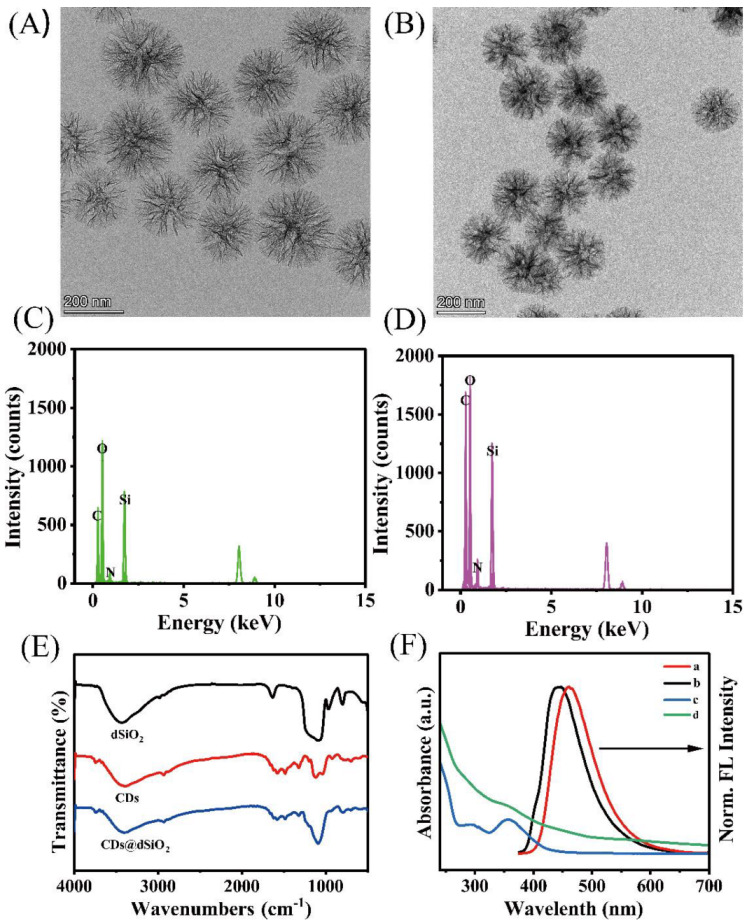
TEM images and EDX of (A, C) dSiO2, (B, D) CDs@dSiO2; (E) FTIR spectra of dSiO2 NPs, CDs, CDs@dSiO2 NPs, respectively, and (F) UV–vis absorption spectrum and fluorescence spectrum of (a, c) CDs, and (b, d) CDs@dSiO2 NPs.
Official websites use .gov
A
.gov website belongs to an official
government organization in the United States.
Secure .gov websites use HTTPS
A lock (
) or https:// means you've safely
connected to the .gov website. Share sensitive
information only on official, secure websites.
TEM images and EDX of (A, C) dSiO2, (B, D) CDs@dSiO2; (E) FTIR spectra of dSiO2 NPs, CDs, CDs@dSiO2 NPs, respectively, and (F) UV–vis absorption spectrum and fluorescence spectrum of (a, c) CDs, and (b, d) CDs@dSiO2 NPs.