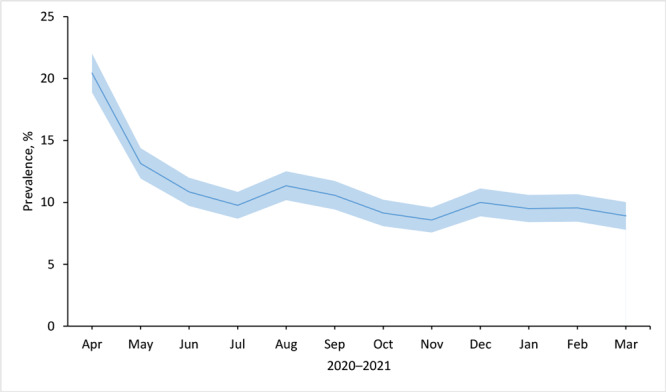
Figure 1.
Prevalence of any food insecurity among respondents (N = 7,944) to the Understanding America Study, Understanding Coronavirus in America tracking survey, April 2020 through March 2021. Shading indicates 95% CIs.
| 2020, % (95% CI) |
2021, % (95% CI) |
||||||||||
|---|---|---|---|---|---|---|---|---|---|---|---|
| Apr | May | Jun | Jul | Aug | Sep | Oct | Nov | Dec | Jan | Feb | Mar |
| 20.4 (18.9-22.0) | 13.1 (11.9-14.4) | 10.8 (9.7-12.0) | 9.8 (8.7-10.8) | 11.3 (10.2-12.5) | 10.6 (9.4-11.7) | 9.1 (8.1-10.2) | 8.6 (7.6-9.6) | 10.0 (8.9-11.1) | 9.5 (8.4-10.6) | 9.5 (8.4-10.7) | 8.9 (7.8-10.0) |

