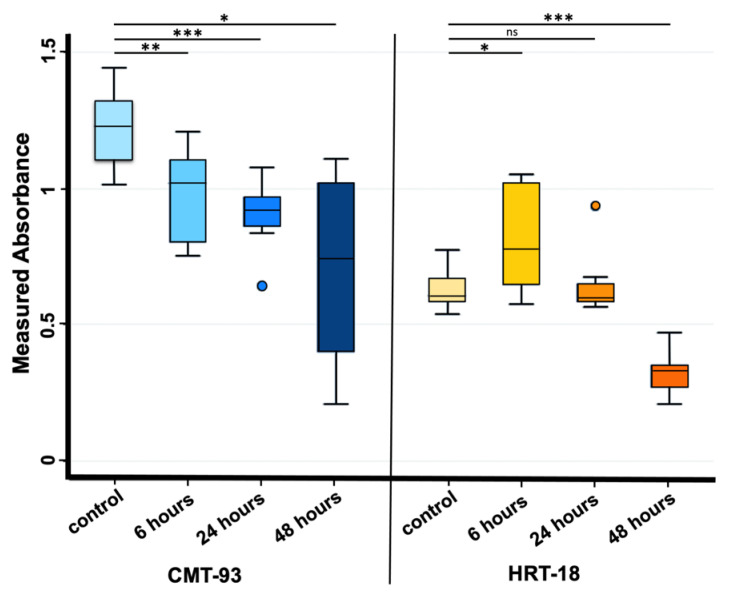
Figure 3.
Absorbance values observed at OD590 nm in CMT-93 (left) and HRT-18 (right) cell cultures measured both in the control group and 6, 24 and 48 h after 1 mg/mL PS-MPs treatment via MTT assay. *** p-value ≤ 0.001; ** p-value ≤ 0.01; * p-value ≤ 0.05; ns p-value > 0.05. Regression model analysis showed a statistically significant trend in CMT-93 cells (left) considering controls and all exposure times (beta value: −0.011, CI: −0.018 −0.006).

