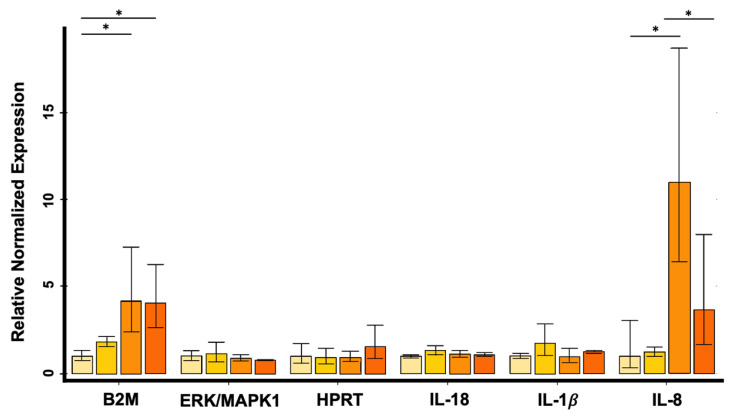
Figure 6.
Relative expression levels of B2M, MAPK1/ERK, HPRT, IL-18, IL-1β and IL-8 in HRT-18 cell line evaluated by quantitative Real-Time PCR (* p < 0.05). Data were reported in linear scale. Cyclin D1 and β-Actin were used as reference genes for normalization. The error bars indicate Standard Deviation.

