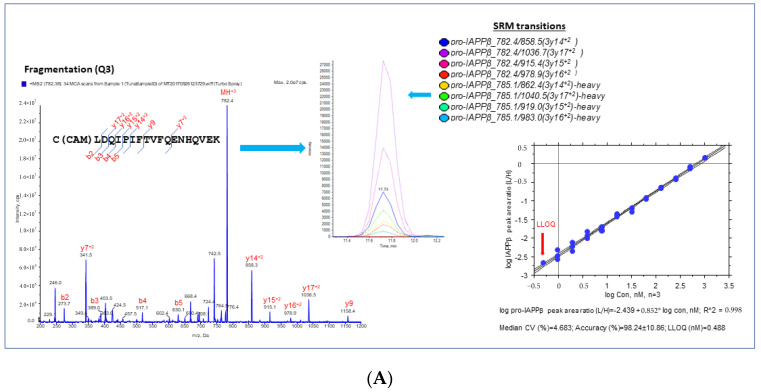
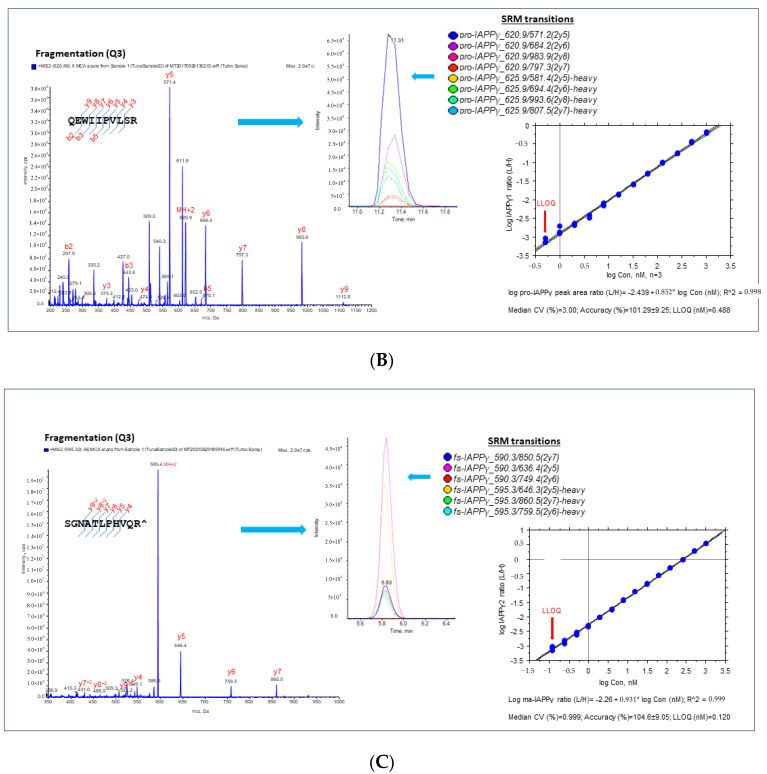
Figure 2.
Proteotypic peptides for SRM assay of IAPPs. MS/MS spectra generated by SRM reaction of transitions with light or heavy SIS of target peptides, pro-IAPPβ (A), pro-IAPPγ (B), and fs-IAPPγ (C) in the (left panels). A set of coeluting peaks in the plasma matrix confirms that the detected SRM signals are derived from each proteotypic peptide in the (middle panels). The quantitative validation of the SRM assay is displayed in the (right panels). The calibration curve of the SRM assay for each proteotypic peptide in the plasma matrix was carried out as follows: (1) linearity was determined by linear regression between the measured peak area ratio of light and heavy SIS versus the theoretical concentration of light-SIS peptide in the plasma matrix prepared from pooled samples; we display the linear regression with the dashed line representing CI (95%) for the mean, n = 3; (2) accuracy was estimated by back fitting data to the STD curve from all quantified points (>5 points) in the plots, as expressed as the mean ± SD (%); and (3) LLOQ was determined from the standard curve, defined as the lowest concentration with acceptable CV < 20% and accuracy within 100 ± 20%.


