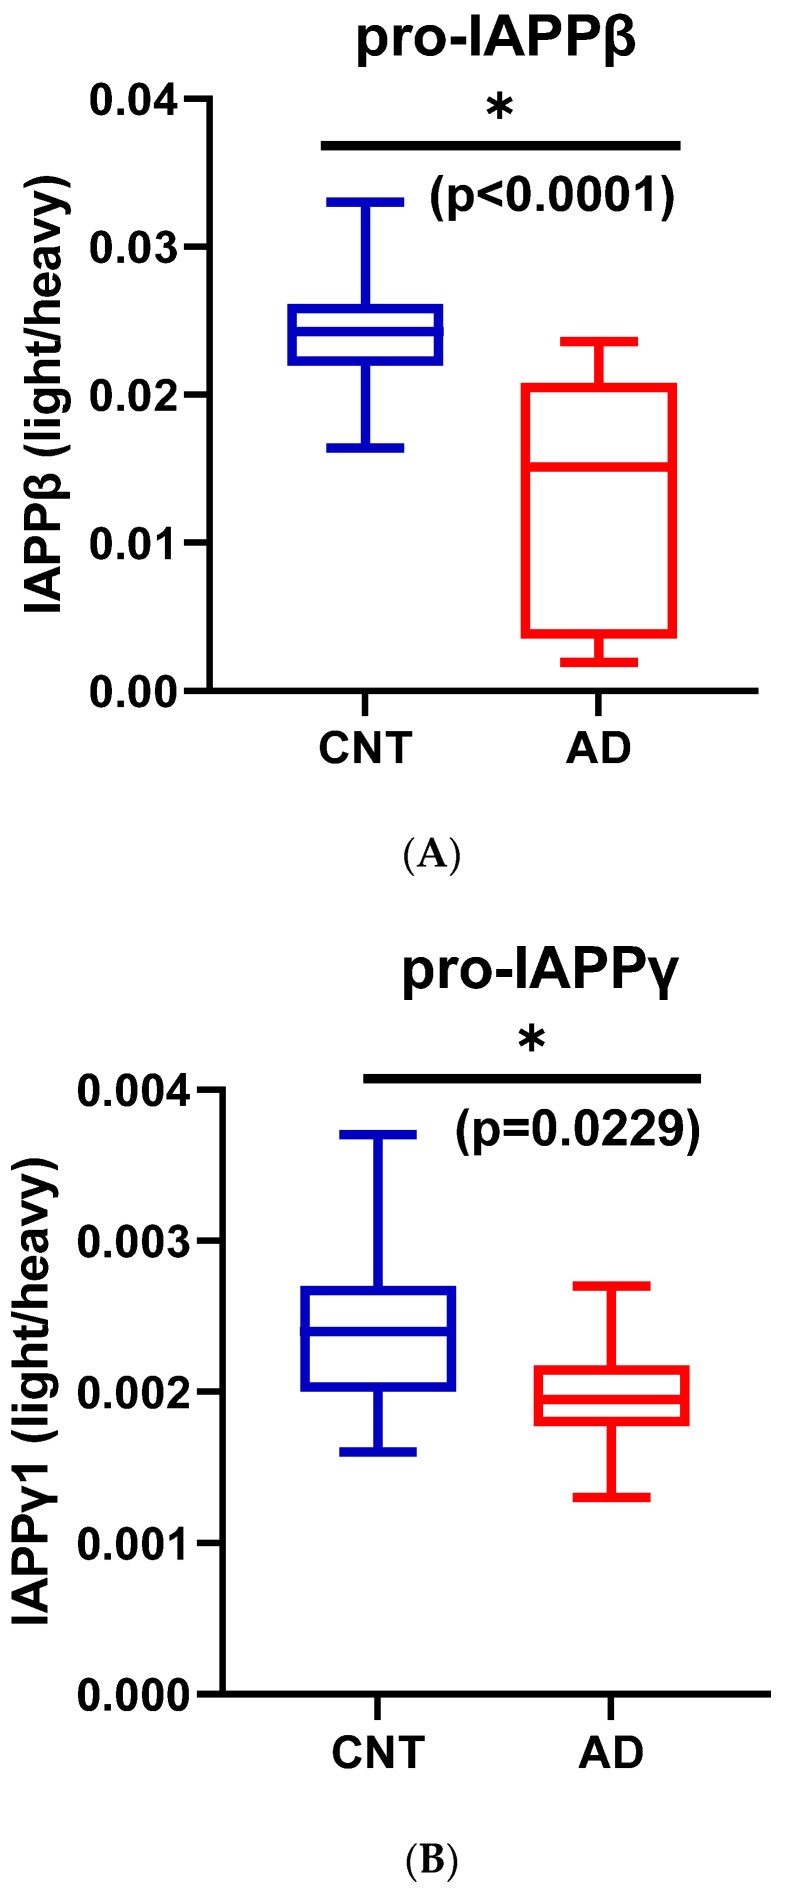
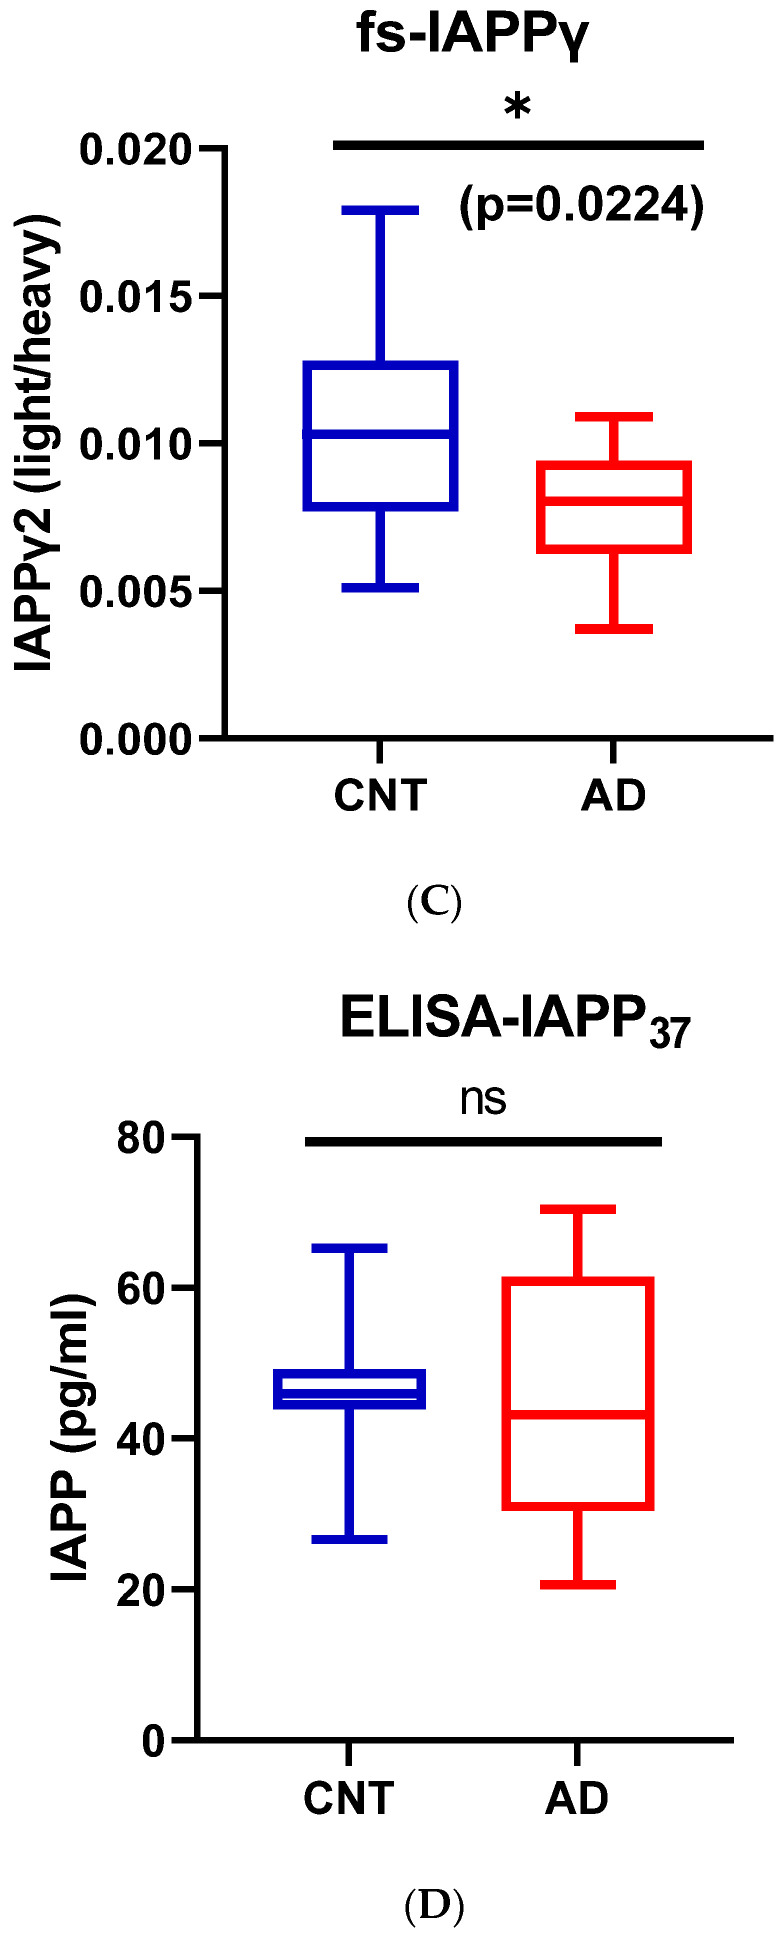
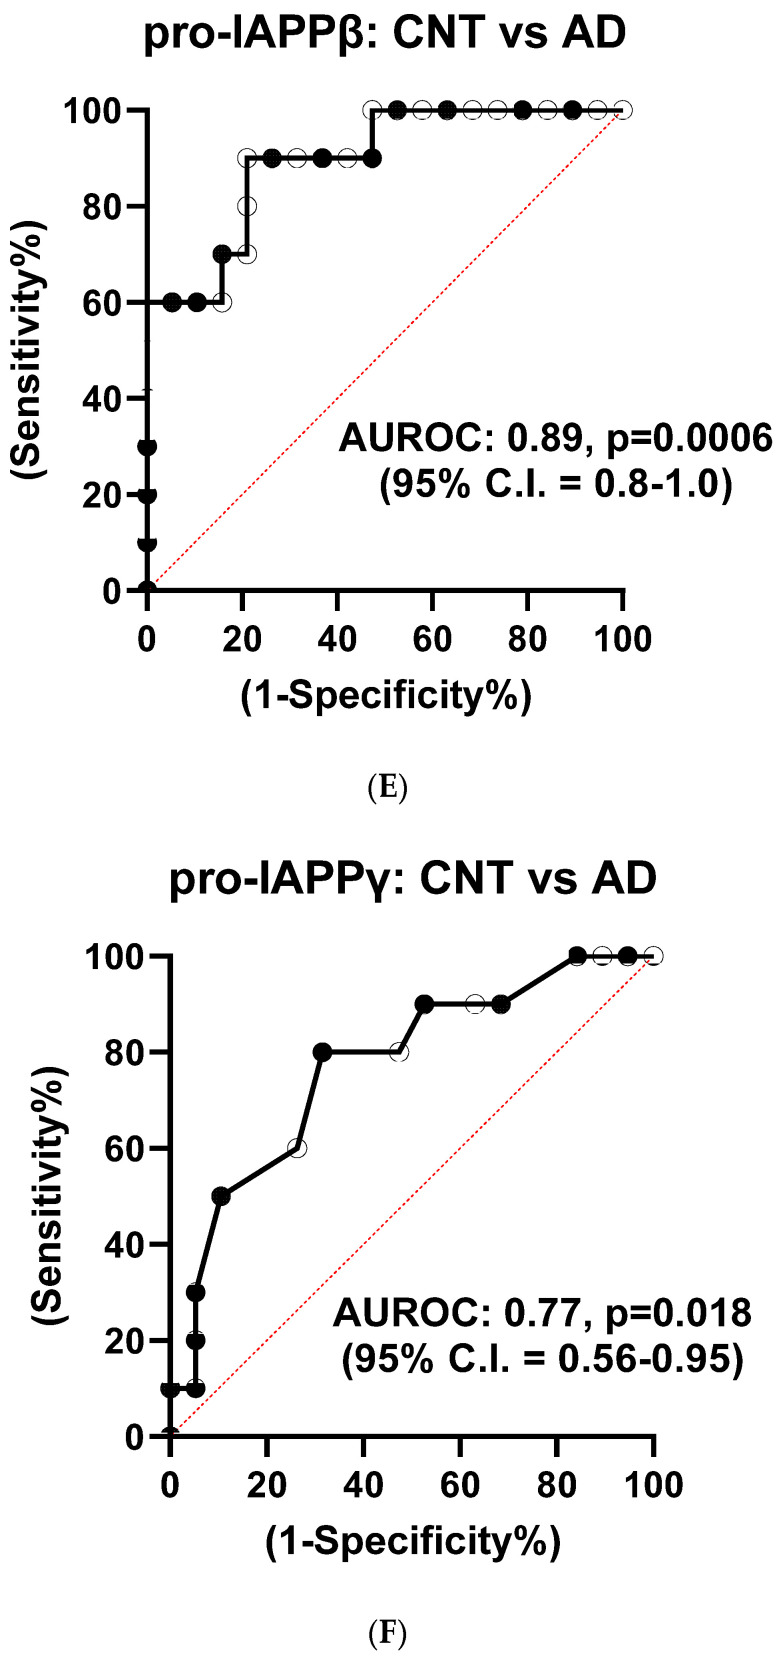
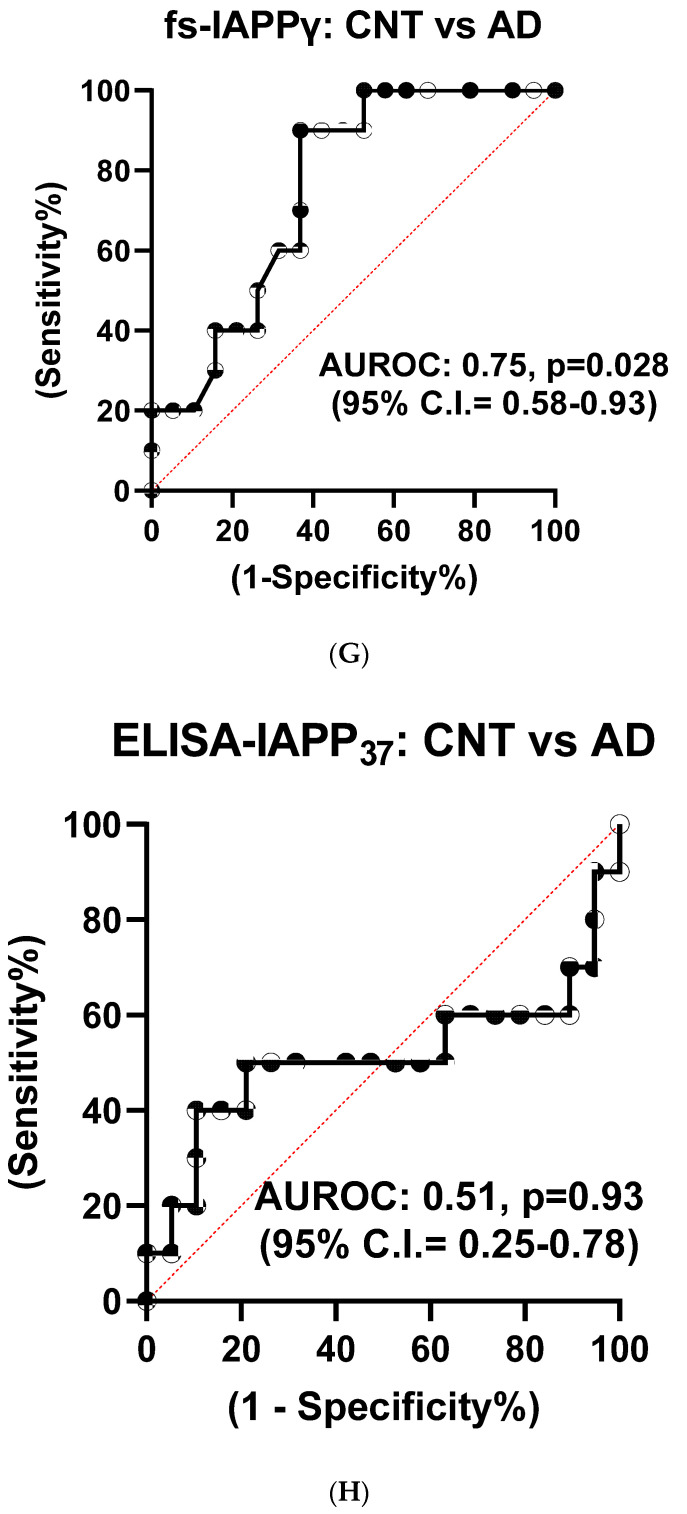
Figure 4.
IAPP isoform peptide concentrations in control and AD plasma samples. Unpaired Student’s t-tests: (A) pro-IAPPβ; (B) pro-IAPPγ; (C) fs-IAPPγ; (D) IAPP-ELISA. The Y-axis is the ratio of peak area (light/heavy) for SRM and pg/mL for ELISA. Area under the receiver operating characteristic curve (AUROC) tests: (E) pro-IAPPβ; (F) pro-IAPPγ; (G) fs-IAPPγ; (H) IAPP-ELISA. The Y-axis is the true positive rate, and the X-axis is the true negative rate. ns: not significant.


