Figure 5.
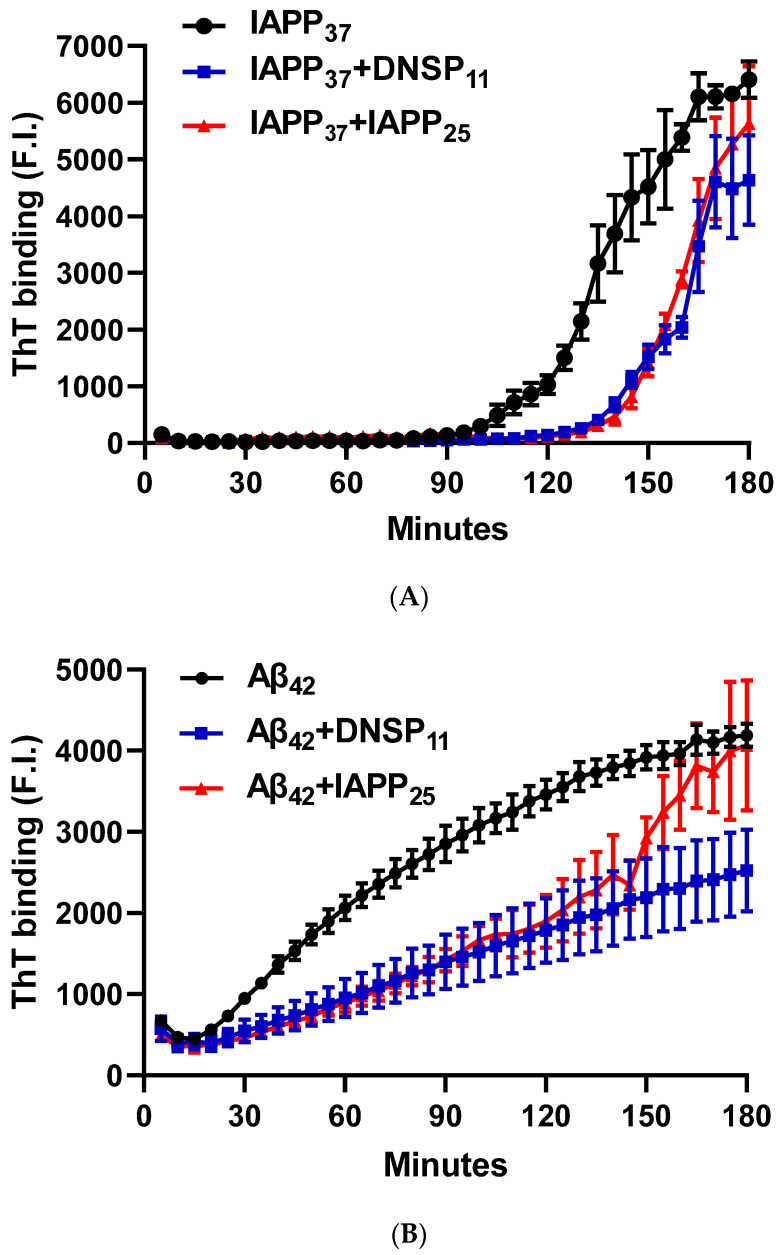
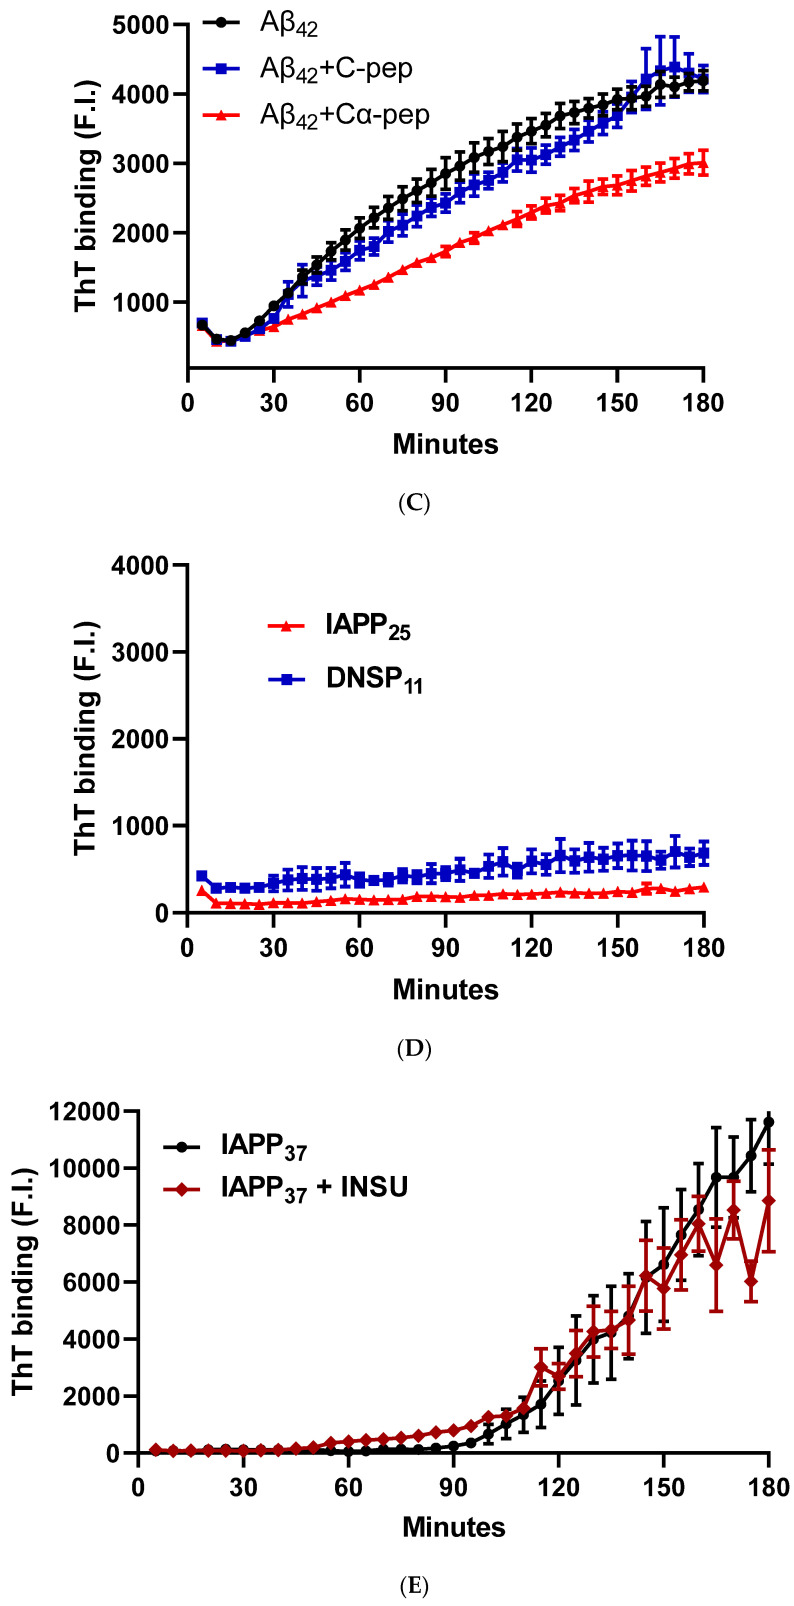
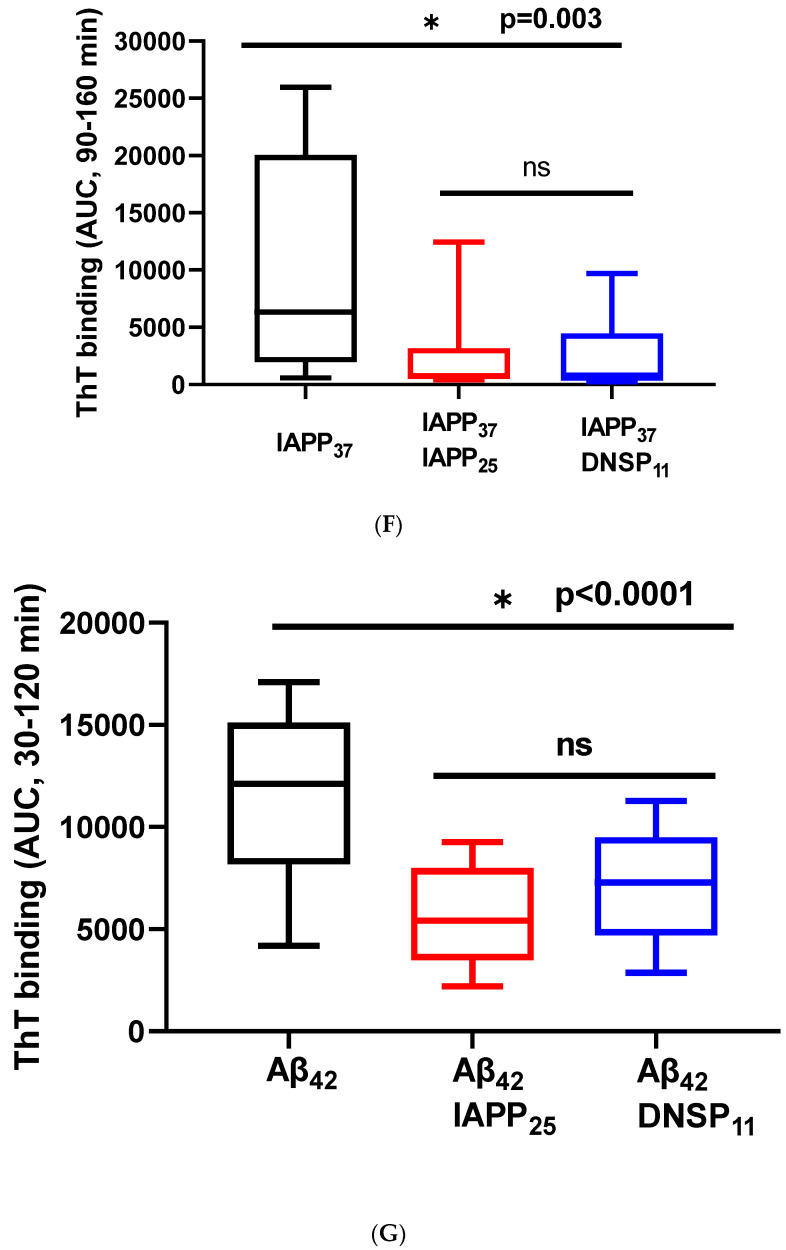
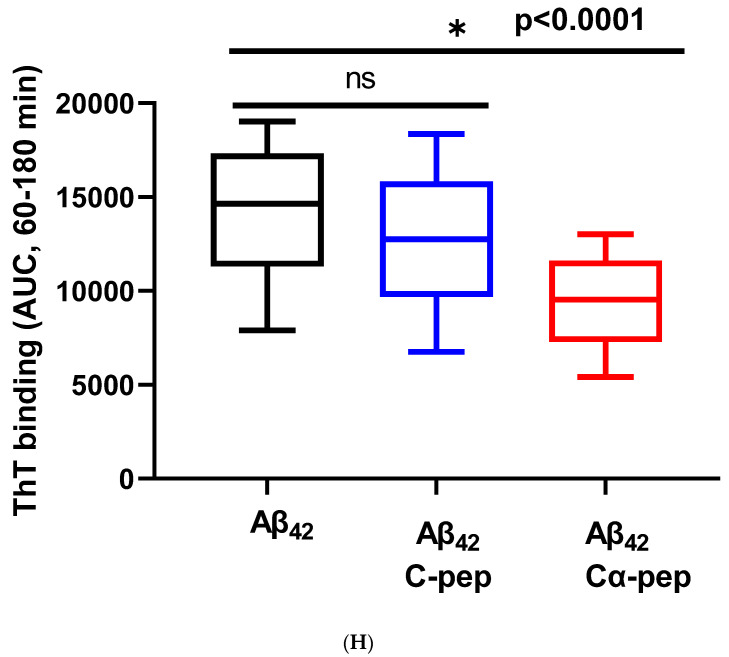
Inhibition of IAPP37 and Aβ42 fibrillation by IAPP25, DNSP11, and Cα-peptide. Y-axis represents the fluorescence intensity (F.I) of ThT binding and X-axis minutes. Representative fibrillation dynamics and inhibition curves in three replicates for (A) IAPP37 with equal molar concentration of IAPP25 and DNSP11; (B) Aβ42 with equal molar concentration of IAPP25 and DNSP11; (C) with equal molar concentration of of C- and Cα-peptides; (D) thioflavin T (ThT) amyloid reporter assay of IAPP25 and DNSP11; IAPP25 or DNSP11 alone did not bind to the ThT amyloid reporter. (E) No inhibition of IAPP37 fibrillation by insulin upstream open reading frame peptide occurs (INSU). Box-whisker plot of the inhibition. Y-axis is the area under the curve (AUC) of ThT fluorescence intensity. (F) Inhibition of IAPP37 fibrillation by IAPP25 and DNSP11 in the range of 90–160 min. (G) Inhibition of Aβ42 fibrillation by IAPP25 and by DNSP11 in the range of 30–120 min and (H) by C- and Cα-peptide in the range of 60–180 min. ns: not significant.


