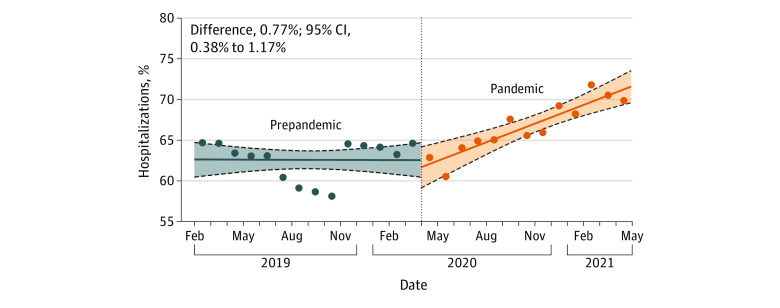
Figure 4. Interrupted Time Series Analysis for Proportion of Hospitalizations Among Females.
Dots represent the proportion of females among mental health–related hospitalizations across all sites in a given month. The result of the interrupted time series analysis is represented as the monthly proportion difference between the prepandemic and pandemic periods. The 95% CIs were estimated using parametric bootstrapping (10 000 iterations). Solid lines represent the medians, the lower and upper dashed lines represent the 2.5th and 97.5th percentiles, respectively, and the shaded area represents the bootstrap iterations between the 2.5th and 97.5th percentiles.

