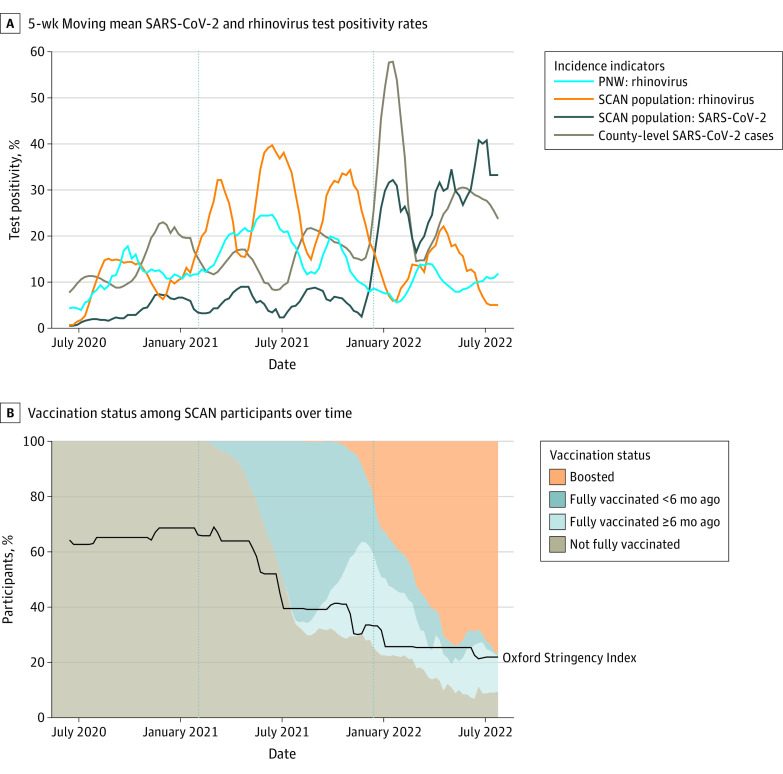
Figure 2. Trends in Viral Circulation, Nonpharmaceutical Interventions, and Vaccination.
A, The 5-week moving average of the percentage of samples positive for SARS-CoV-2 and rhinovirus in the Seattle Coronavirus Assessment Network (SCAN) study population over time, the square root of the reported SARS-CoV-2 cases in King County divided by 3 (for easier visualization), and the percentage of positive rhinovirus tests in the Pacific Northwest (PNW) surveillance system. Vertical dashed lines separate time-periods (wild-type variant, pre-Omicron variants, Omicron variants). B, The percentage of SCAN study participants by vaccination status (not fully vaccinated includes unvaccinated or received an incomplete primary schedule) and the weekly average of the Oxford Stringency Index in Washington State,34 which reflects the strength of interventions on a scale of 0% to 100%. Dashed lines separate time-periods (wild-type variant, pre-Omicron variants, Omicron variants).

