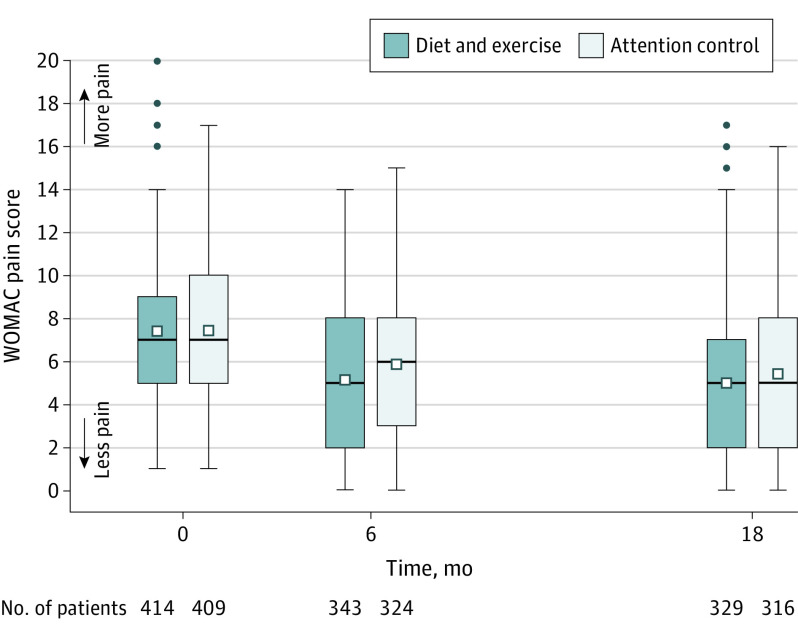
Figure 2. Unadjusted Mean WOMAC Pain Scores for Patients for Whom Follow-up Data Were Available at 6 Months and/or 18 Months.
WOMAC indicates Western Ontario and McMaster Universities Osteoarthritis Index (range, 0 [no pain] to 20 [severe pain]). Box plots are shown for the primary outcome of pain, in which the middle lines represent median values; squares, mean values; and boxes, IQRs. Whiskers extend to the most extreme observed values within 1.5 times the IQR of the nearer quartile, and dots represent observed values outside the range. Unadjusted means are for the diet and exercise and attention control groups across the 18-month intervention period. The within-group minimum clinically important improvement at 18 months is a 20% improvement from baseline or 1.5 points. The between-group minimum clinically important difference is 1.6 points using the half-SD formula.24

