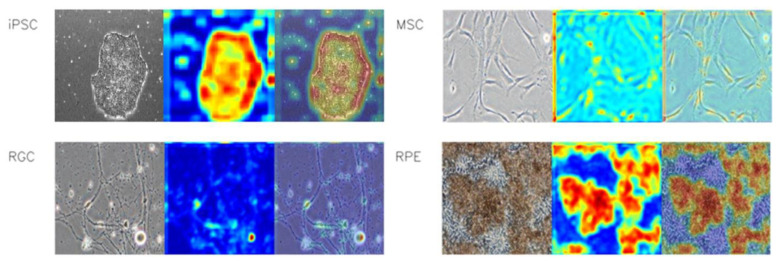
Figure 4.
Comparison of four cell types with the heatmap imaging. For each indicated cell type, the left panel shows the representative phase-contrast microscopy image, the middle panel shows the heatmap calculated by the CNN model, and the right panel shows the overlay of the heatmap and the input.

