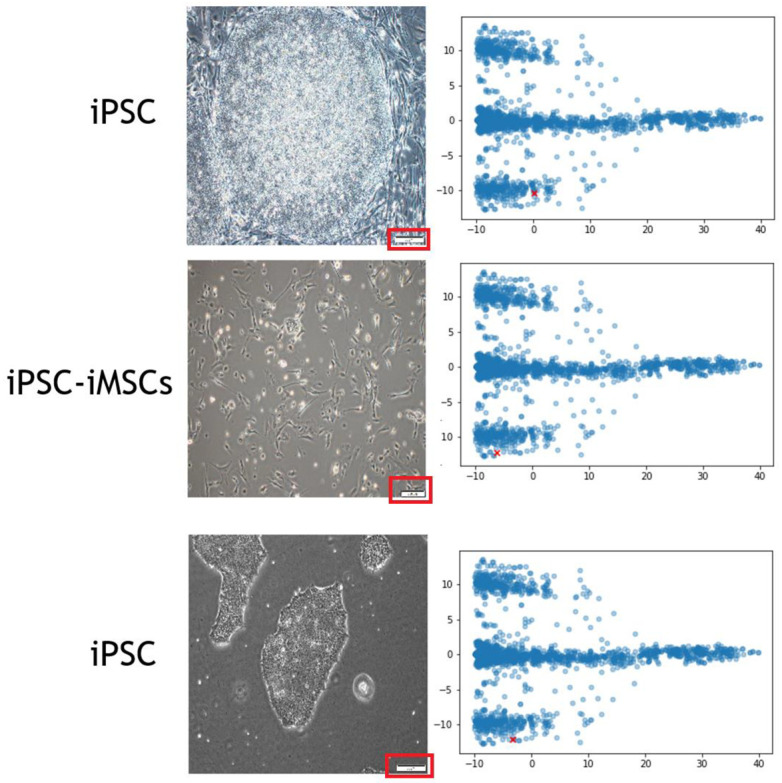
Figure 5.

A representative image interpretation by our proposed model. The cell images (left side) with scale bars (red rectangle) were subjected to the training of our proposed model. When using PCA to reduce the dimension (right side), the scale bars can be detected in the feature coordination (red cross point).
