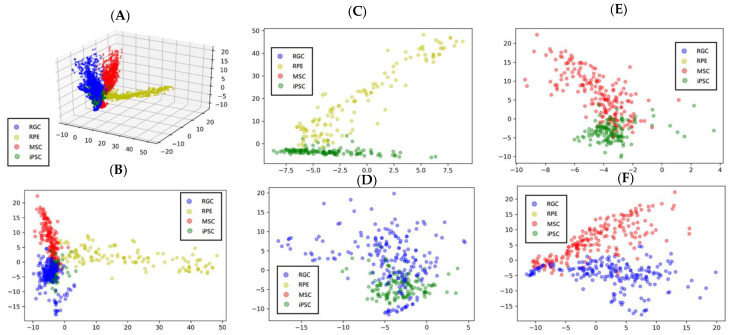
Figure 7.
Three-dimensional projection, the maximum projection results, and two-dimensional projection of iPSCs, iPSC-MSCs, iPSC-RPEs, and iPSC-RGCs after using PCA for the output of the multi-slice tensor model. (A) The three-dimensional projection of four cell types; (B) Results of the maximal 2D projection; (C) The projection of iPSCs and iPSC-RPEs (D) the projection of iPSCs and iPSC-RGCs; (E) the projection of iPSCs and iPSC-MSCs; (F) the projection of MSCs and iPSC-RGCs.

