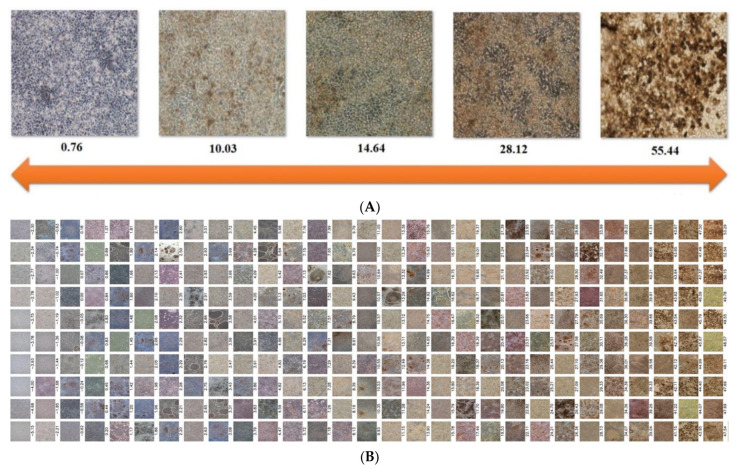
Figure 8.
Evaluation of the RPE differentiation degree by the value of the PCA projection. (A) From left to right, the larger value reflects higher differentiation degree of iPSC-RPEs. (B) Sorting the values of projections of iPSC-RPEs. From left to right: the larger value reflects higher differentiation degree of iPSC-RPEs.

