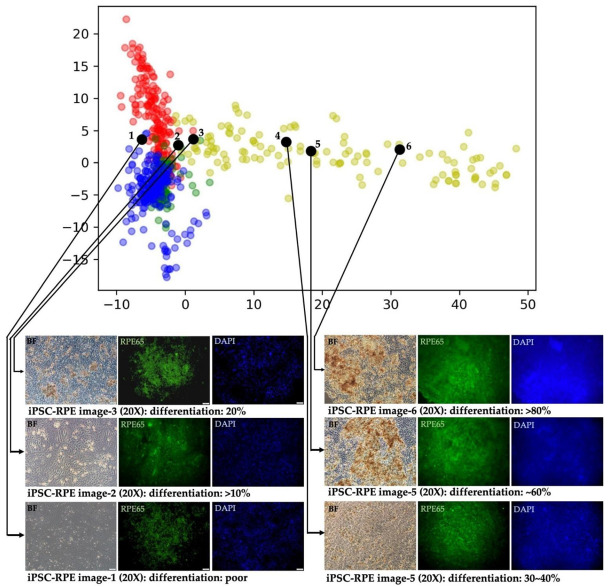
Figure 9.
Using iPSC-RPEs with various differentiation degree as the input to verify the accuracy of iPSC-RPE image recognition by the multi-slice tensor model. In the scatter plot of iPSC-RPEs (yellow green spots), iPSC-RPEs with poor differentiation were projected to the left side, iPSC-RPEs with moderate differentiation to the middle, and iPSC-RPEs with high differentiation-to the right side of the scatter plot.

