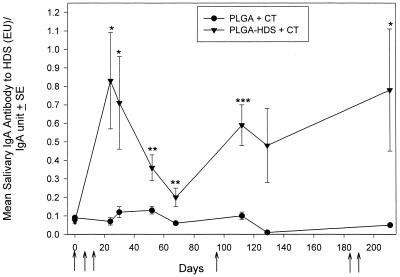
FIG. 1.
Salivary IgA responses to HDS peptide after i.n. administration of PLGA-HDS with 5 μg of CT. Closed triangles indicate the mean salivary IgA EU/relative salivary IgA unit ratios in rats immunized with PLGA-HDS microparticles and CT. Closed circles indicate the antibody levels of rats with unloaded PLGA microparticles and CT. The brackets enclose two standard errors. Arrows indicate the days of administration. Significance (∗, P < 0.001; ∗∗, P < 0.04; ∗∗, = P < 0.01) was determined with respect to the sham group response on the respective day. Salivas were tested at a 1:8 dilution.

