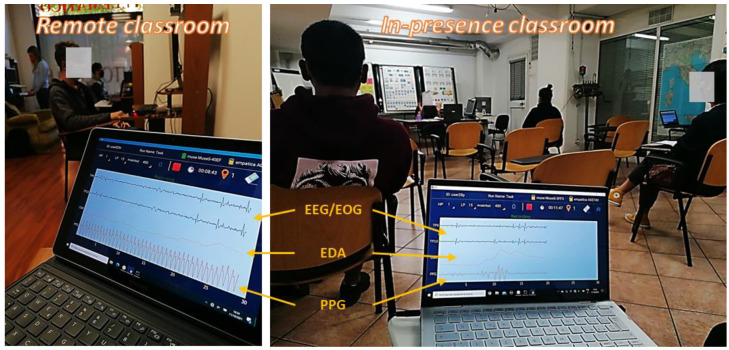
Figure 2.
Two pictures of signal recording during the experimental task in both conditions (IN-PRESENCE and REMOTE). In particular, the first two blue channels are related to the EEG data gathered from Muse S, from which the EOG pattern was obtained (the blink shapes are visible). The last two orange channels are, respectively, the EDA and PPG data gathered from Empatica.

