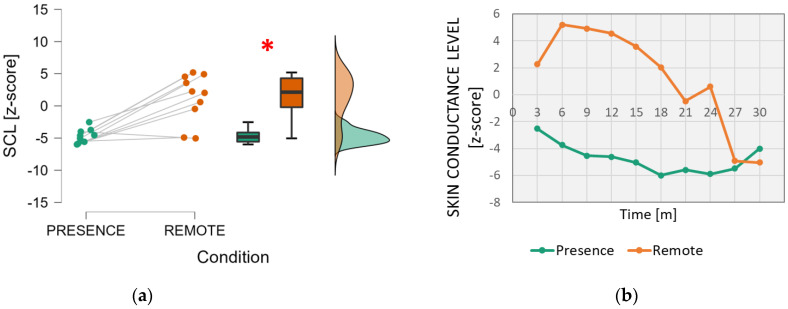
Figure 6.
Analysis of the electrodermal activity, particularly the Skin Conductance Level. On the left (a), mean and confidence interval (95%) of the distributions related to the two conditions (In-presence and Remote). The red asterisk indicates the presence of a statistically significant effect. On the right (b), the dynamics of the SCL parameter averaged across students during the time span of the lesson. The red asterisk indicates the statistically significant (p < 0.05) result.

