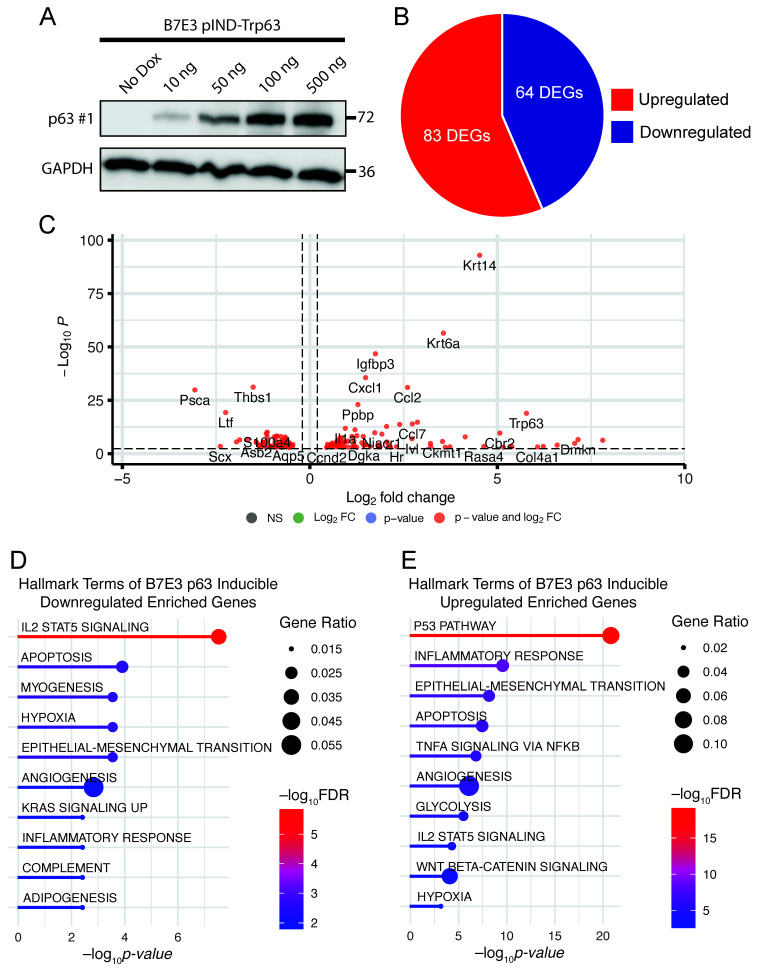
Figure 4.
p63 overexpression in p63low B7E3 cells. (A) Western blot analysis of p63 expression in B7E3 cells with dox-inducible p63 expression. GAPDH was used as a loading control. A pie chart (B) and a volcano plot (C) of DEGs resulting from induced p63 overexpression in B7E3 cells. Enriched hallmark terms in downregulated (D) and upregulated (E) DEGs in p63-overexpressing B7E3 cells.

