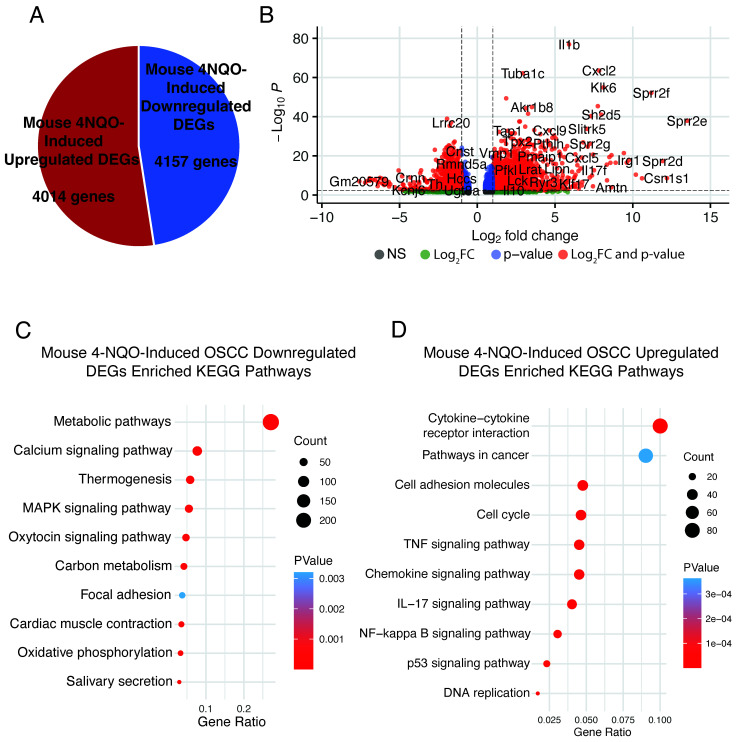
Figure 5.
Investigating the p63-driven gene signature in an independent 4NQO-induced mOSCC model. A pie chart (A) and a volcano plot (B) of DEGs in the dataset by Tang et al. [11]. Enriched KEGG pathways in downregulated (C) and upregulated (D) DEGs from the dataset by Tang et al.

