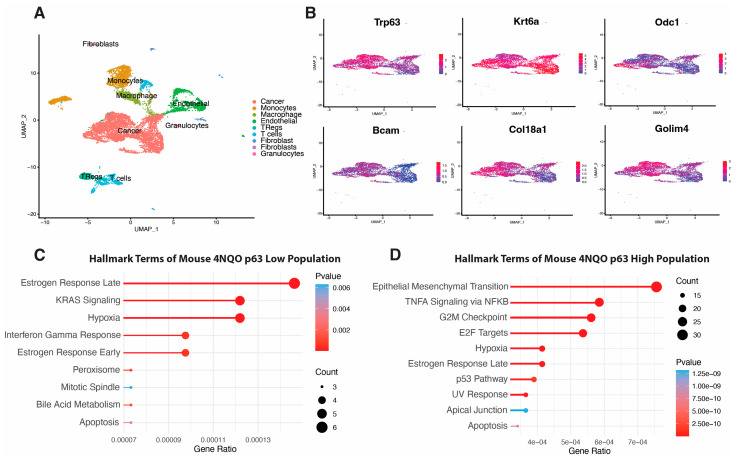
Figure 7.
scRNA-seq analysis of 4NQO-induced mouse ESCC shows enrichment of our p63-based OSCC gene signature. (A) UMAP clustering of different cell types in mouse ESCC tumors. (B) UMAPs shows a zoomed-in cancer cell cluster highlighted from overall UMAP clustering. UMAP distribution of p63 expression across tumor cell clusters highlights p63high and p63low populations. DEG analysis of p63high versus p63low cells shows enrichment of several DEGs previously identified in the p63-based gene expression signature. UMAP projections display the expression of these factors across the tumor cell population. Enriched hallmark terms in DEGs enriched in p63low (C) and p63high (D) cells.

