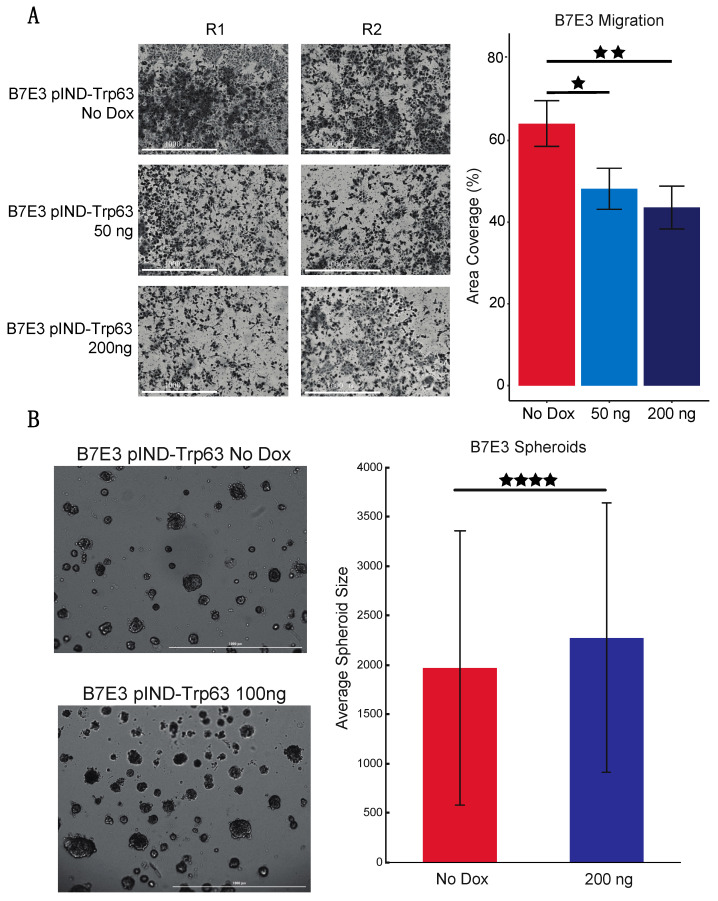
Figure 8.
p63 regulates mOSCC cell line migration and proliferation. (A) Transwell migration assay with B7E3 cells with p63 expression induced by 50 or 200 ng dox. Cells that migrated through the Matrigel matrix by 12 h were then imaged and quantified by using ImageJ. (B) Spheroid assay with B7E3 cells with inducible p63 expression. Cells were treated with no dox or 100 ng of dox and allowed to form spheroids for 9 days. The sizes of the top 500 largest spheroids in both groups were then quantified using ImageJ. Values are presented as mean ± SD. Significance level was determined using two-tailed Student’s t-test for samples of equal variance. ★ p < 0.05, ★★ p < 0.01, and ★★★★ p < 0.001.

