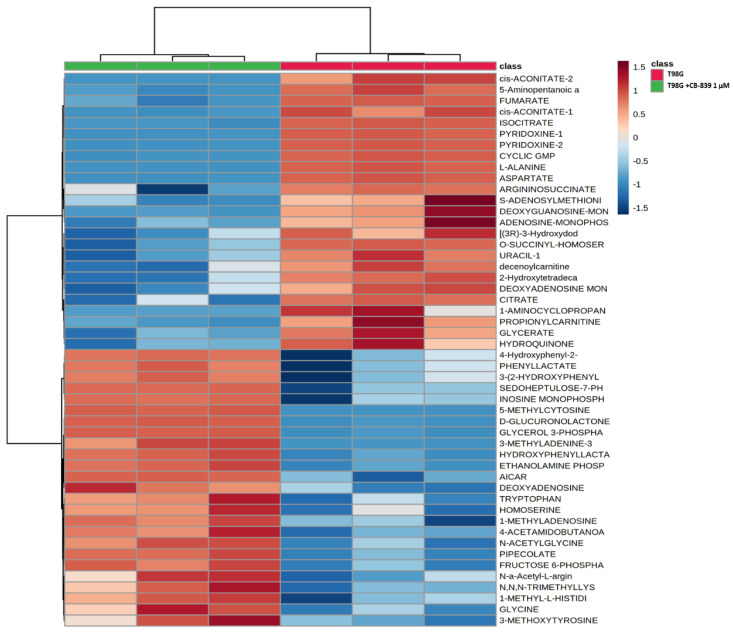
Figure 4.
Metabolomic changes elicited by CB-839 are depicted on a representative hierarchical clustering analysis of key molecules in the T98G glioma cell line. The heat map shows the top 50 differentially altered metabolites in GBM cells were exposed for 24 h to 1 μM CB-839. The samples were run in triplicate. For more details, see Section 2.

