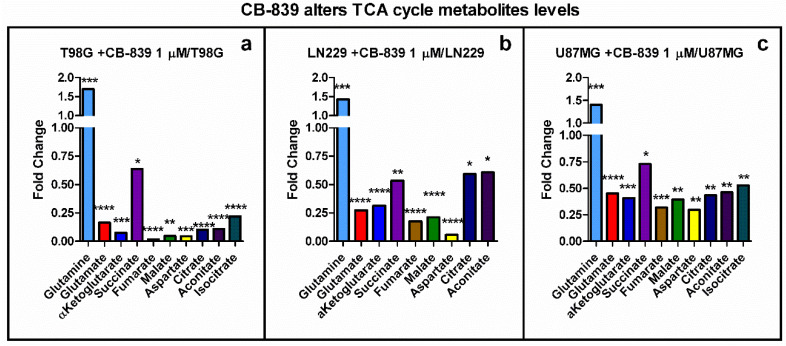
Figure 7.
TCAC metabolites altered by specific GLS inhibitor CB-839. Results are depicted for T98G (a), LN229 (b), and U87MG (c). The samples were run in triplicate. For more details, see Section 2. * p < 0.05, ** p < 0.01, *** p < 0.001, **** p < 0.0001.

