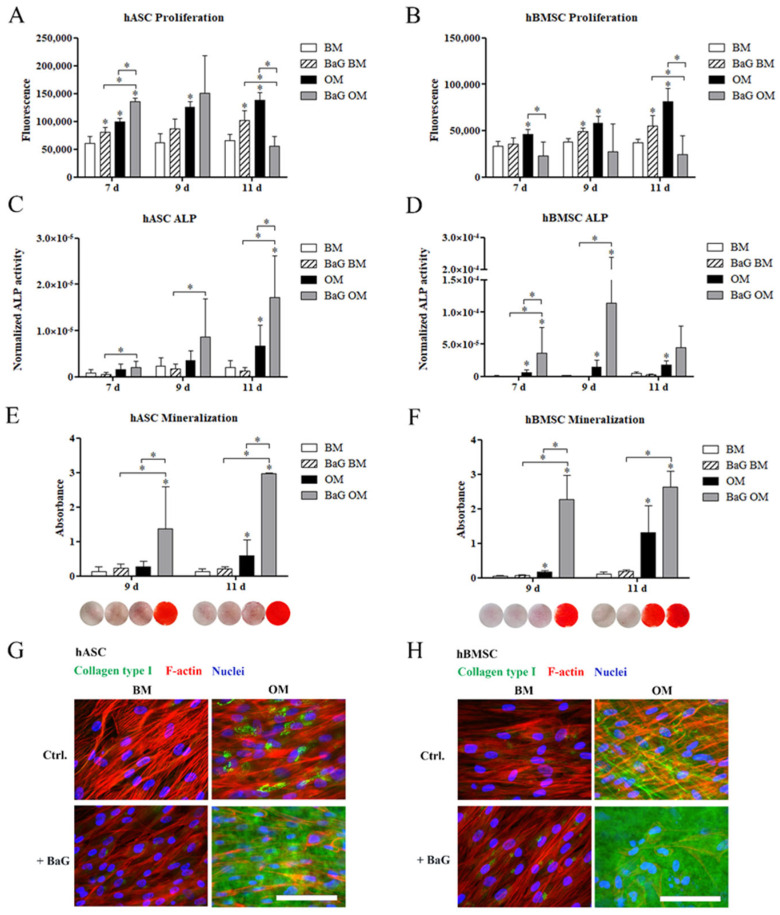
Figure 1.
Cell proliferation and osteogenic differentiation of hASCs and hBMSCs. hASCs and hBMSCs were cultured in BM, BaG BM, OM, and BaG OM. (A,B) Cell proliferation was studied with CyQUANT assay after 7, 9, and 11 days of culture. (C,D) ALP activity was studied after 7, 9, and 11 days of culture and is presented normalized, with the corresponding cell amounts. (E,F) Matrix mineralization was analyzed with Alizarin Red staining after 9 and 11 days of culture. Qualitative representative results (stained wells, area 1.9 cm2) are presented below the corresponding graphs. Bright red staining represents the mineral. (G,H) Representative images of collagen type I stained hASCs and hBMSCs at 11 d. Scale bars 100 µm. Statistical analysis: cell proliferation and ALP analyses; N = 9, independent biological replicates of three donors of each cell type. Mineralization; hASCs: N = 9 independent biological replicates of three donors; and hBMSCs: N = 6 independent biological replicates of two donors. Statistical analysis was conducted within time point, * p ˂ 0.05. The asterisk above the error bar indicates the statistical difference compared to the BM control, other comparisons are indicated with lines. Abbreviations: alkaline phosphatase, ALP; basic medium, BM; osteogenic medium, OM; and bioactive glass, BaG.

