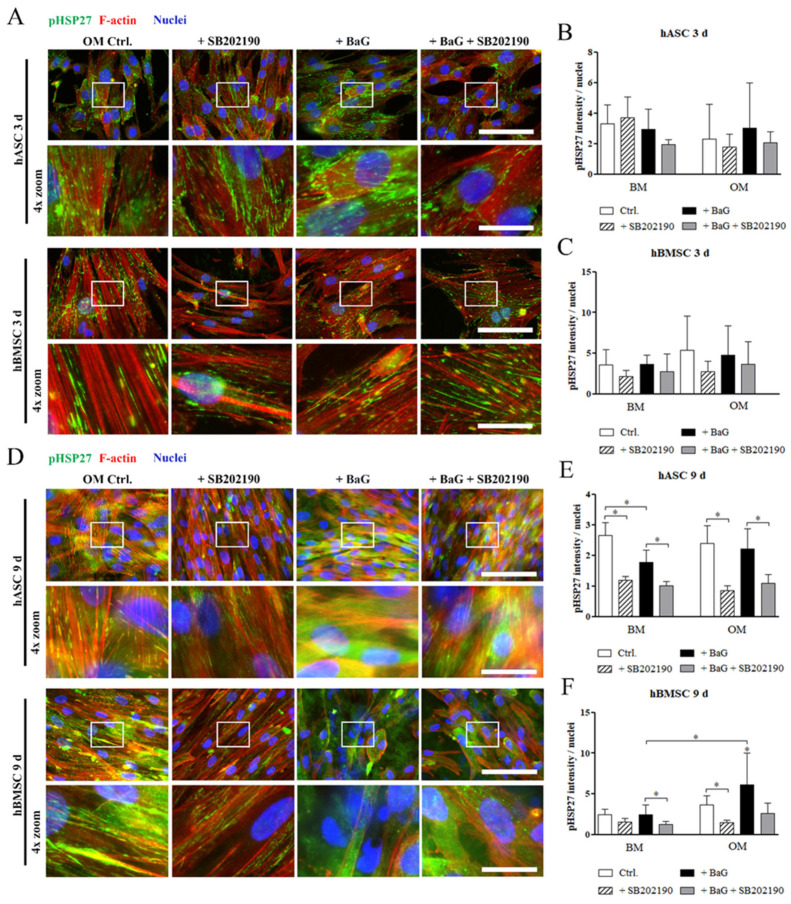
Figure 5.
Cellular localization of phosphorylated HSP27 in hASCs and hBMSCs. (A,D) Representative images of pHSP28(S78) stained hASCs and hBMSCs, after 3 and 9 days of culture in OM and BaG OM. Fluorescence images were taken with a 40 X magnification and with filters for pHSP27(S78) (Alexa 488, green), actin (Alexa 546, red), and nuclei (DAPI, blue). The 4 X digital zoom images are presented below the corresponding original images, indicated with white rectangles. Secondary antibody controls are presented in Figure S2b. Scale bars are 100 µm in the original images and 25 µm in the zoom images. (B,C,E,F) Image-based quantification of mean grey values of pHSP27 stained hASCs and hBMSCs normalized with nuclei count. Statistical analysis: hASCs: N = 6–9 (3 d)/8–10 (9 d) images, 2 independent biological replicates of 2 donors; hBMSCs: N = 7–9 (3 d)/7–11 (9 d) images, 2 independent biological replicates of 2 donors. Representative images of hASCs and hBMSCs cultured in BM and BaG BM conditions are in Figure S6b,c. * p ˂ 0.05. The asterisk above the error bar indicates the statistical difference compared to the BM control, and other comparisons are indicated with lines. Abbreviations: basic medium, BM; osteogenic medium, OM; and bioactive glass, BaG.

