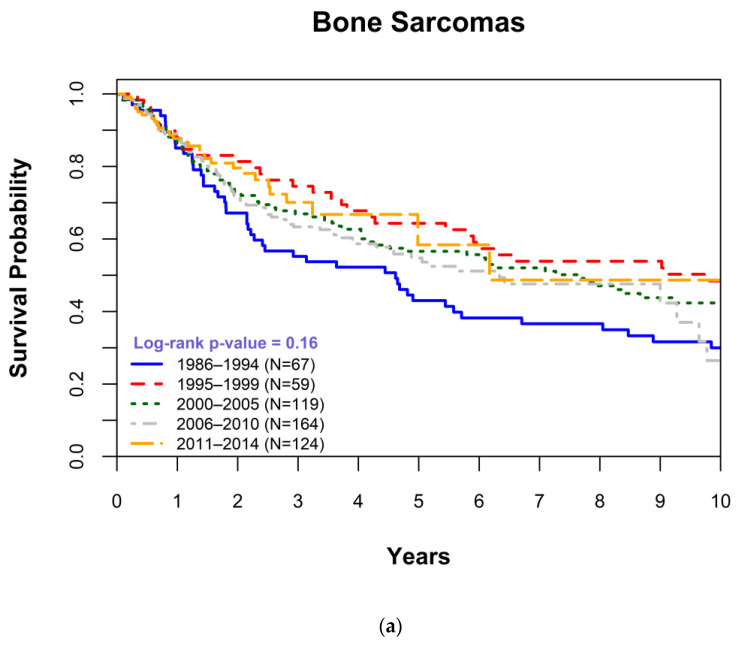
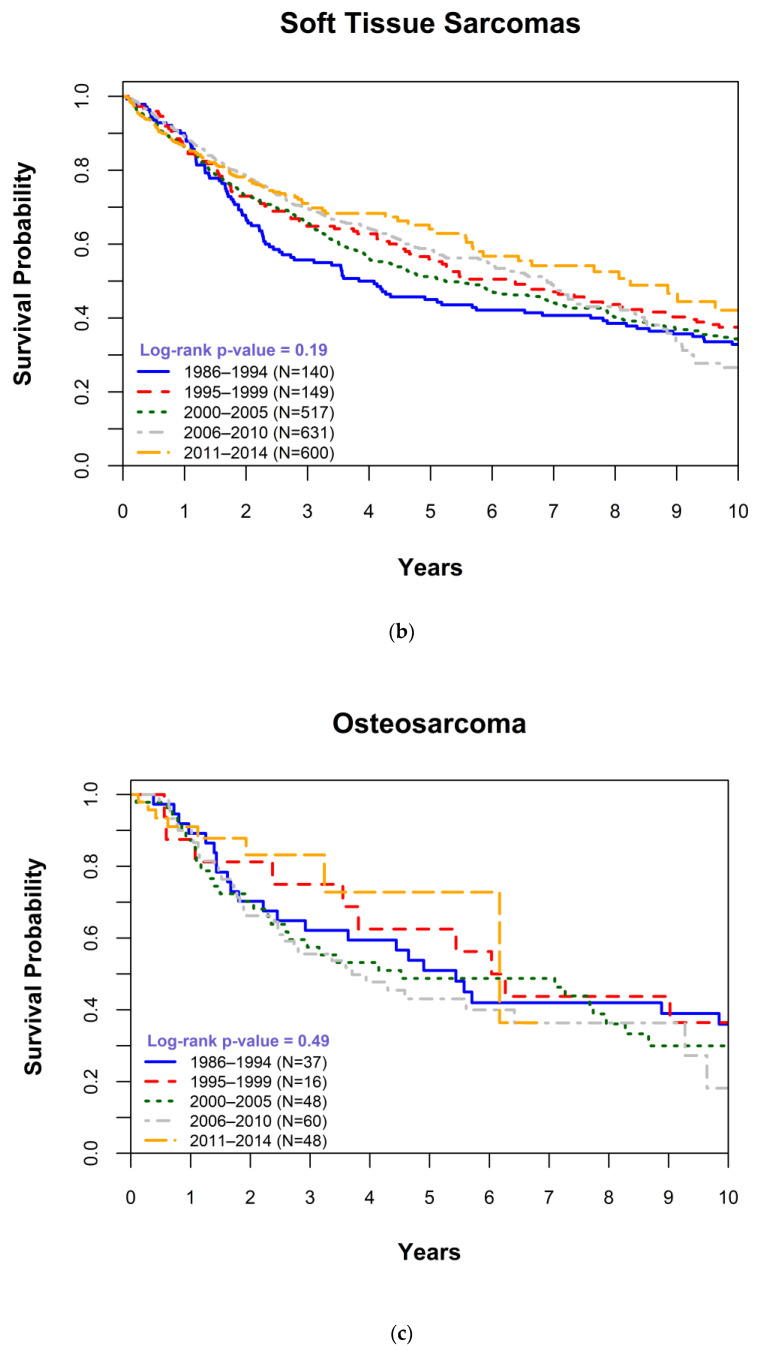
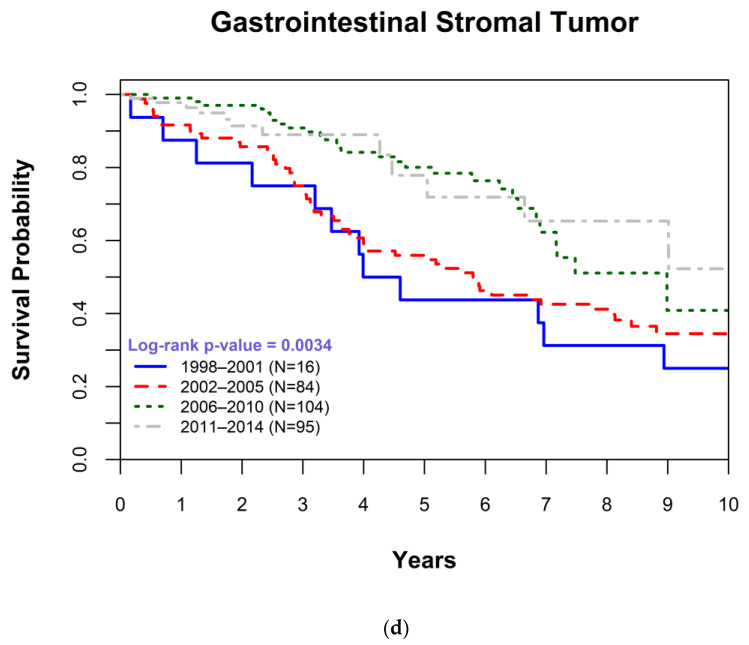
Figure 1.
Kaplan-Meier survival plot comparing overall survival (OS) for each time period for patients with (a) bone sarcomas, (b) soft tissue sarcomas, (c) an osteosarcoma, and (d) a gastrointestinal stromal tumor. OS was right-censored at 10 years associated and p-values were determined using log-rank statistics.


