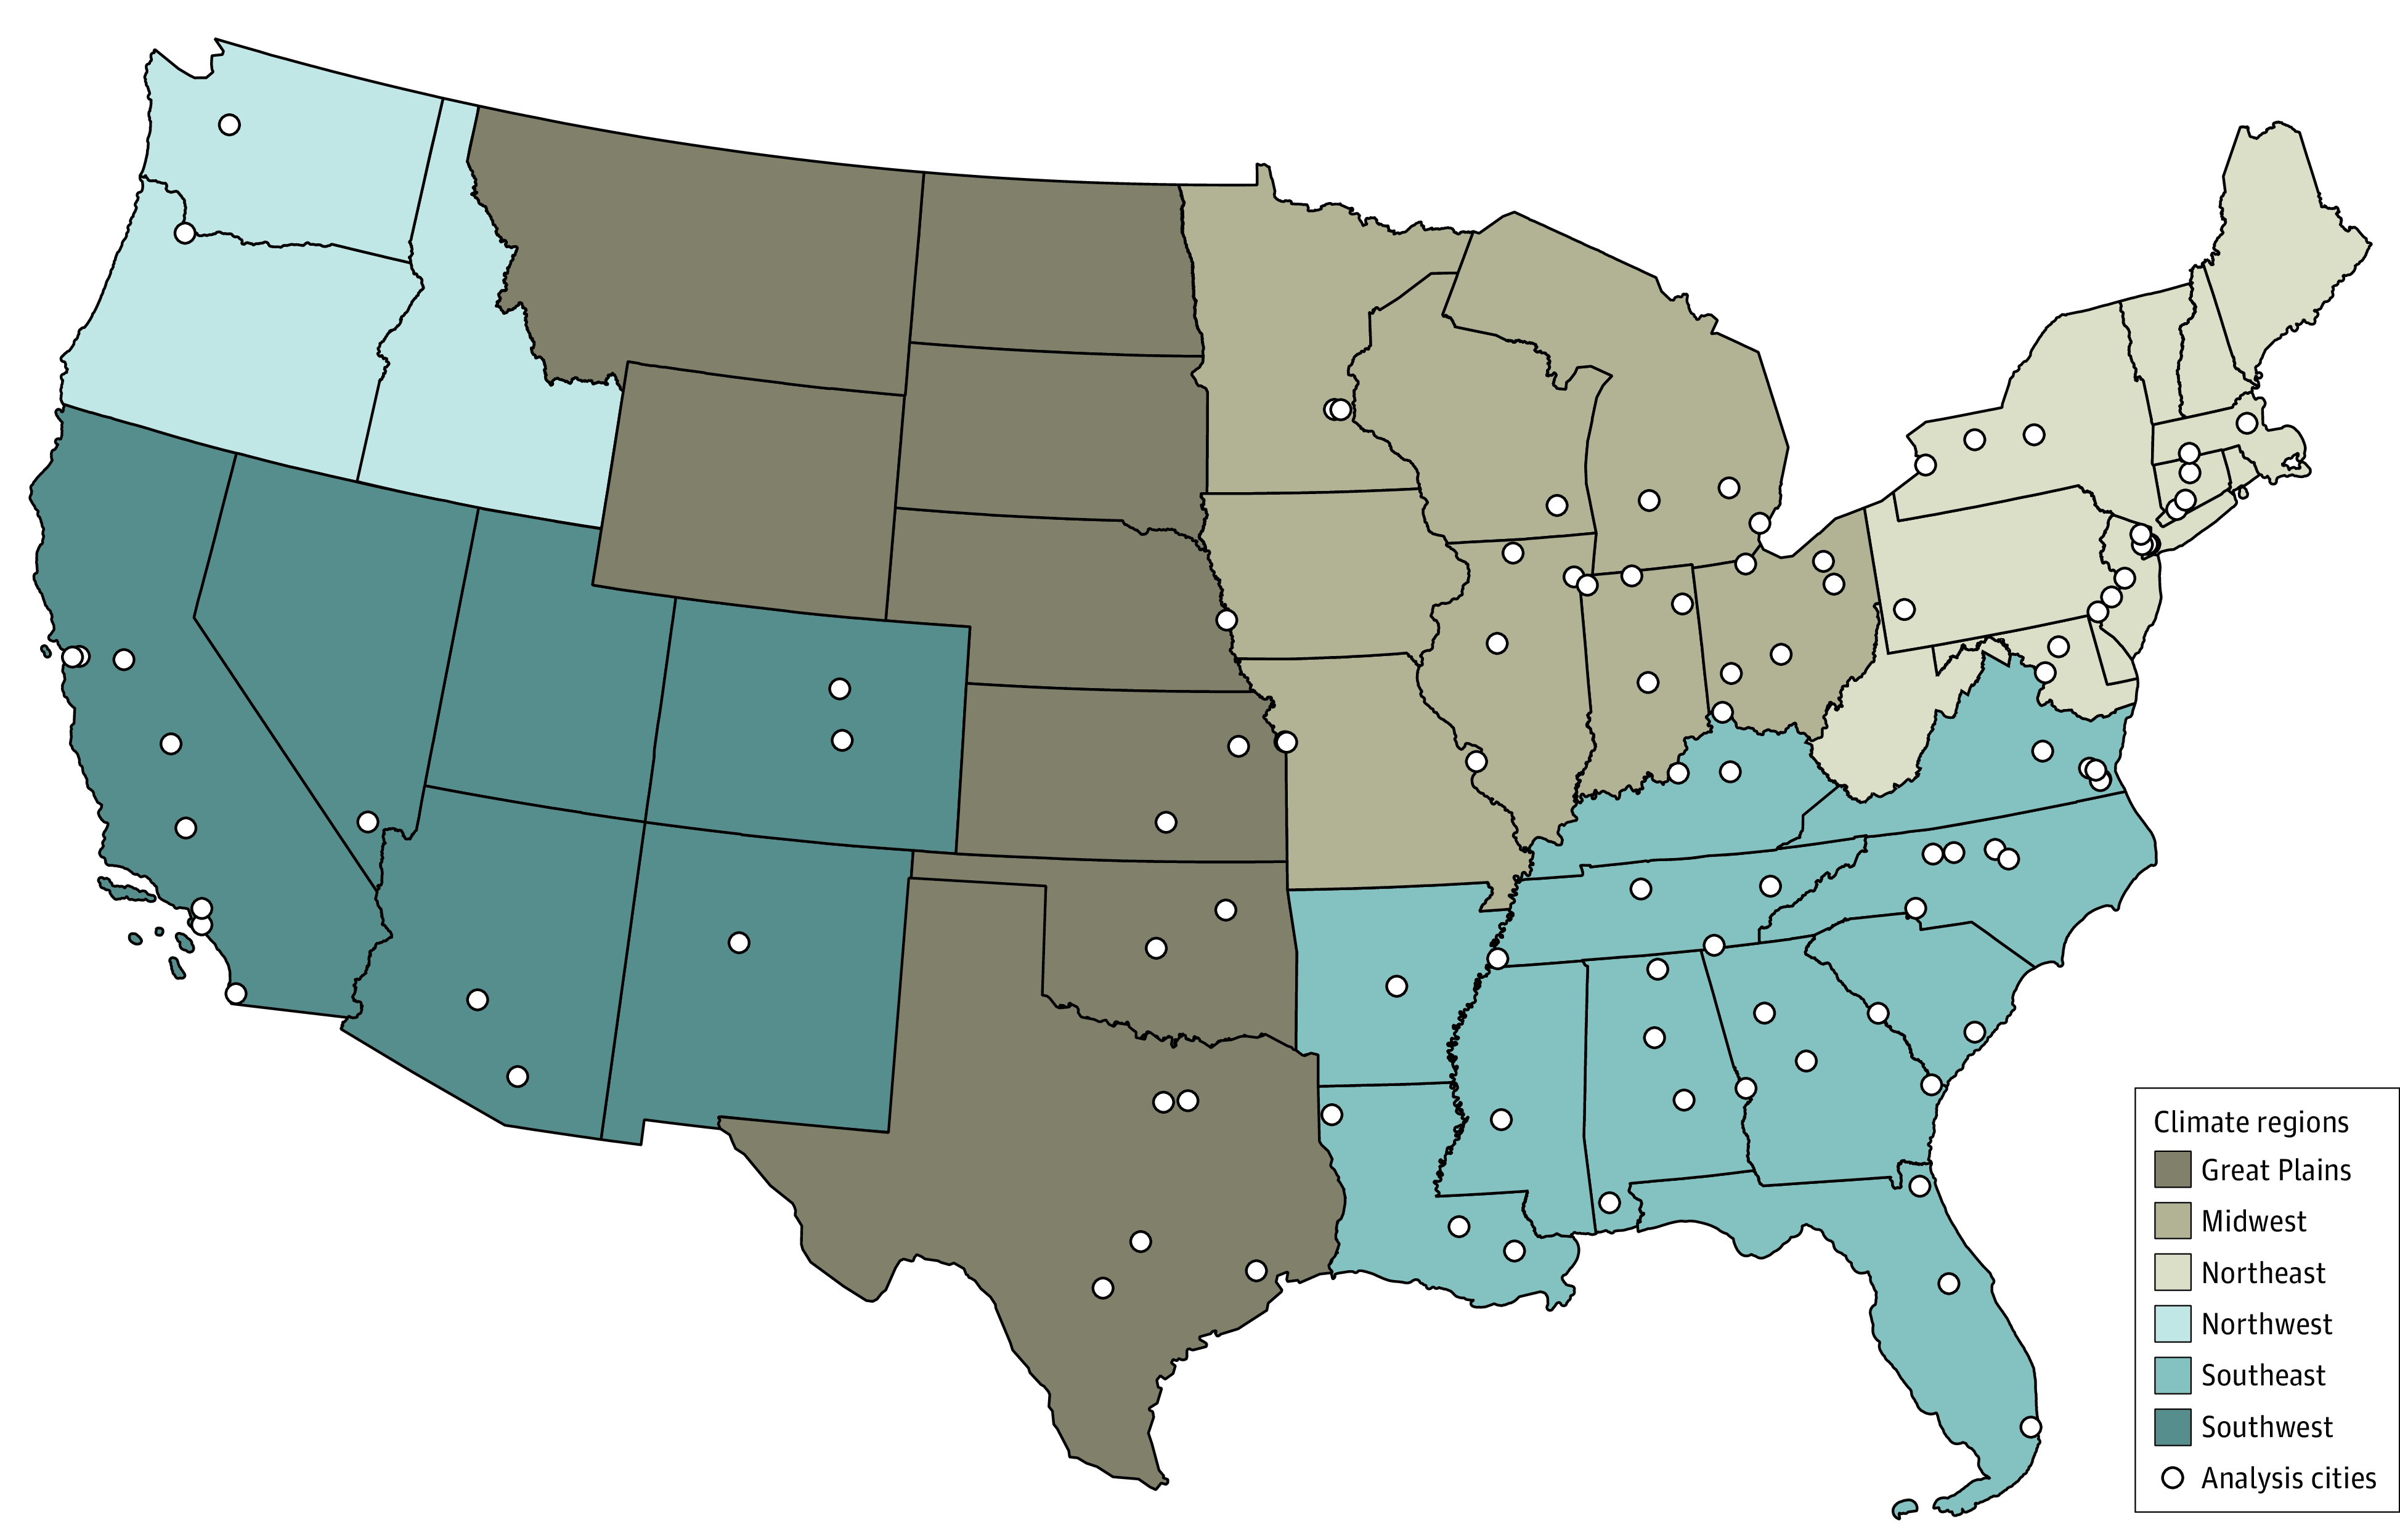
Figure 1. Geographic Distribution of the 100 Analysis Cities by Climate Region.

This map shows states categorized according to their climate region (from the National Climate Assessment). The white dots represent the location of the 100 cities that were included in this analysis.
