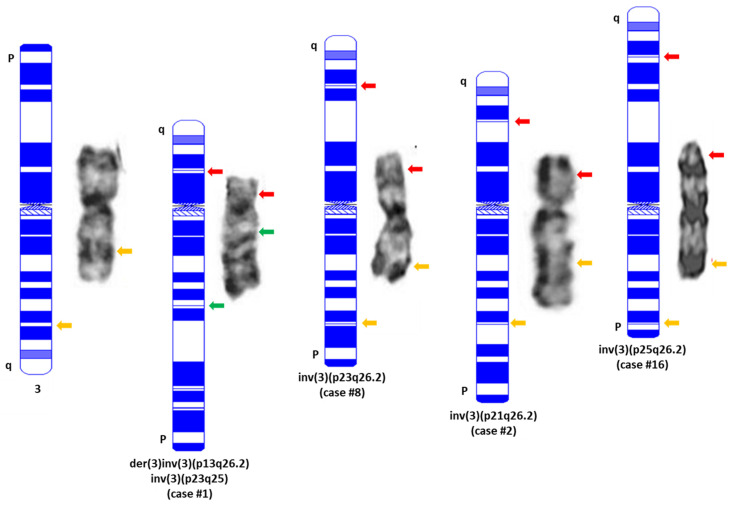
Figure 3.
Representative images of normal chromosome 3 and pericentric inv(3)s detected in this study. A karyogram drawn using online software (CyDAS, http://www.cydas.org/OnlineAnalysis/ accessed on 10 November 2022) is placed on the left side of each chromosome with an indication of the sites and colors of MECOM BAP FISH using the two-color commercial probe in this study. Yellow: intact MECOM signal; Red: 5′MECOM; Green: 3′MECOM. It is necessary to point out that all the pericentric inv(3)s listed in this figure are intentionally exhibited in a direction from q (top) to p (bottom) after inversion so that their centromeres remain as the normal chromosome 3.

