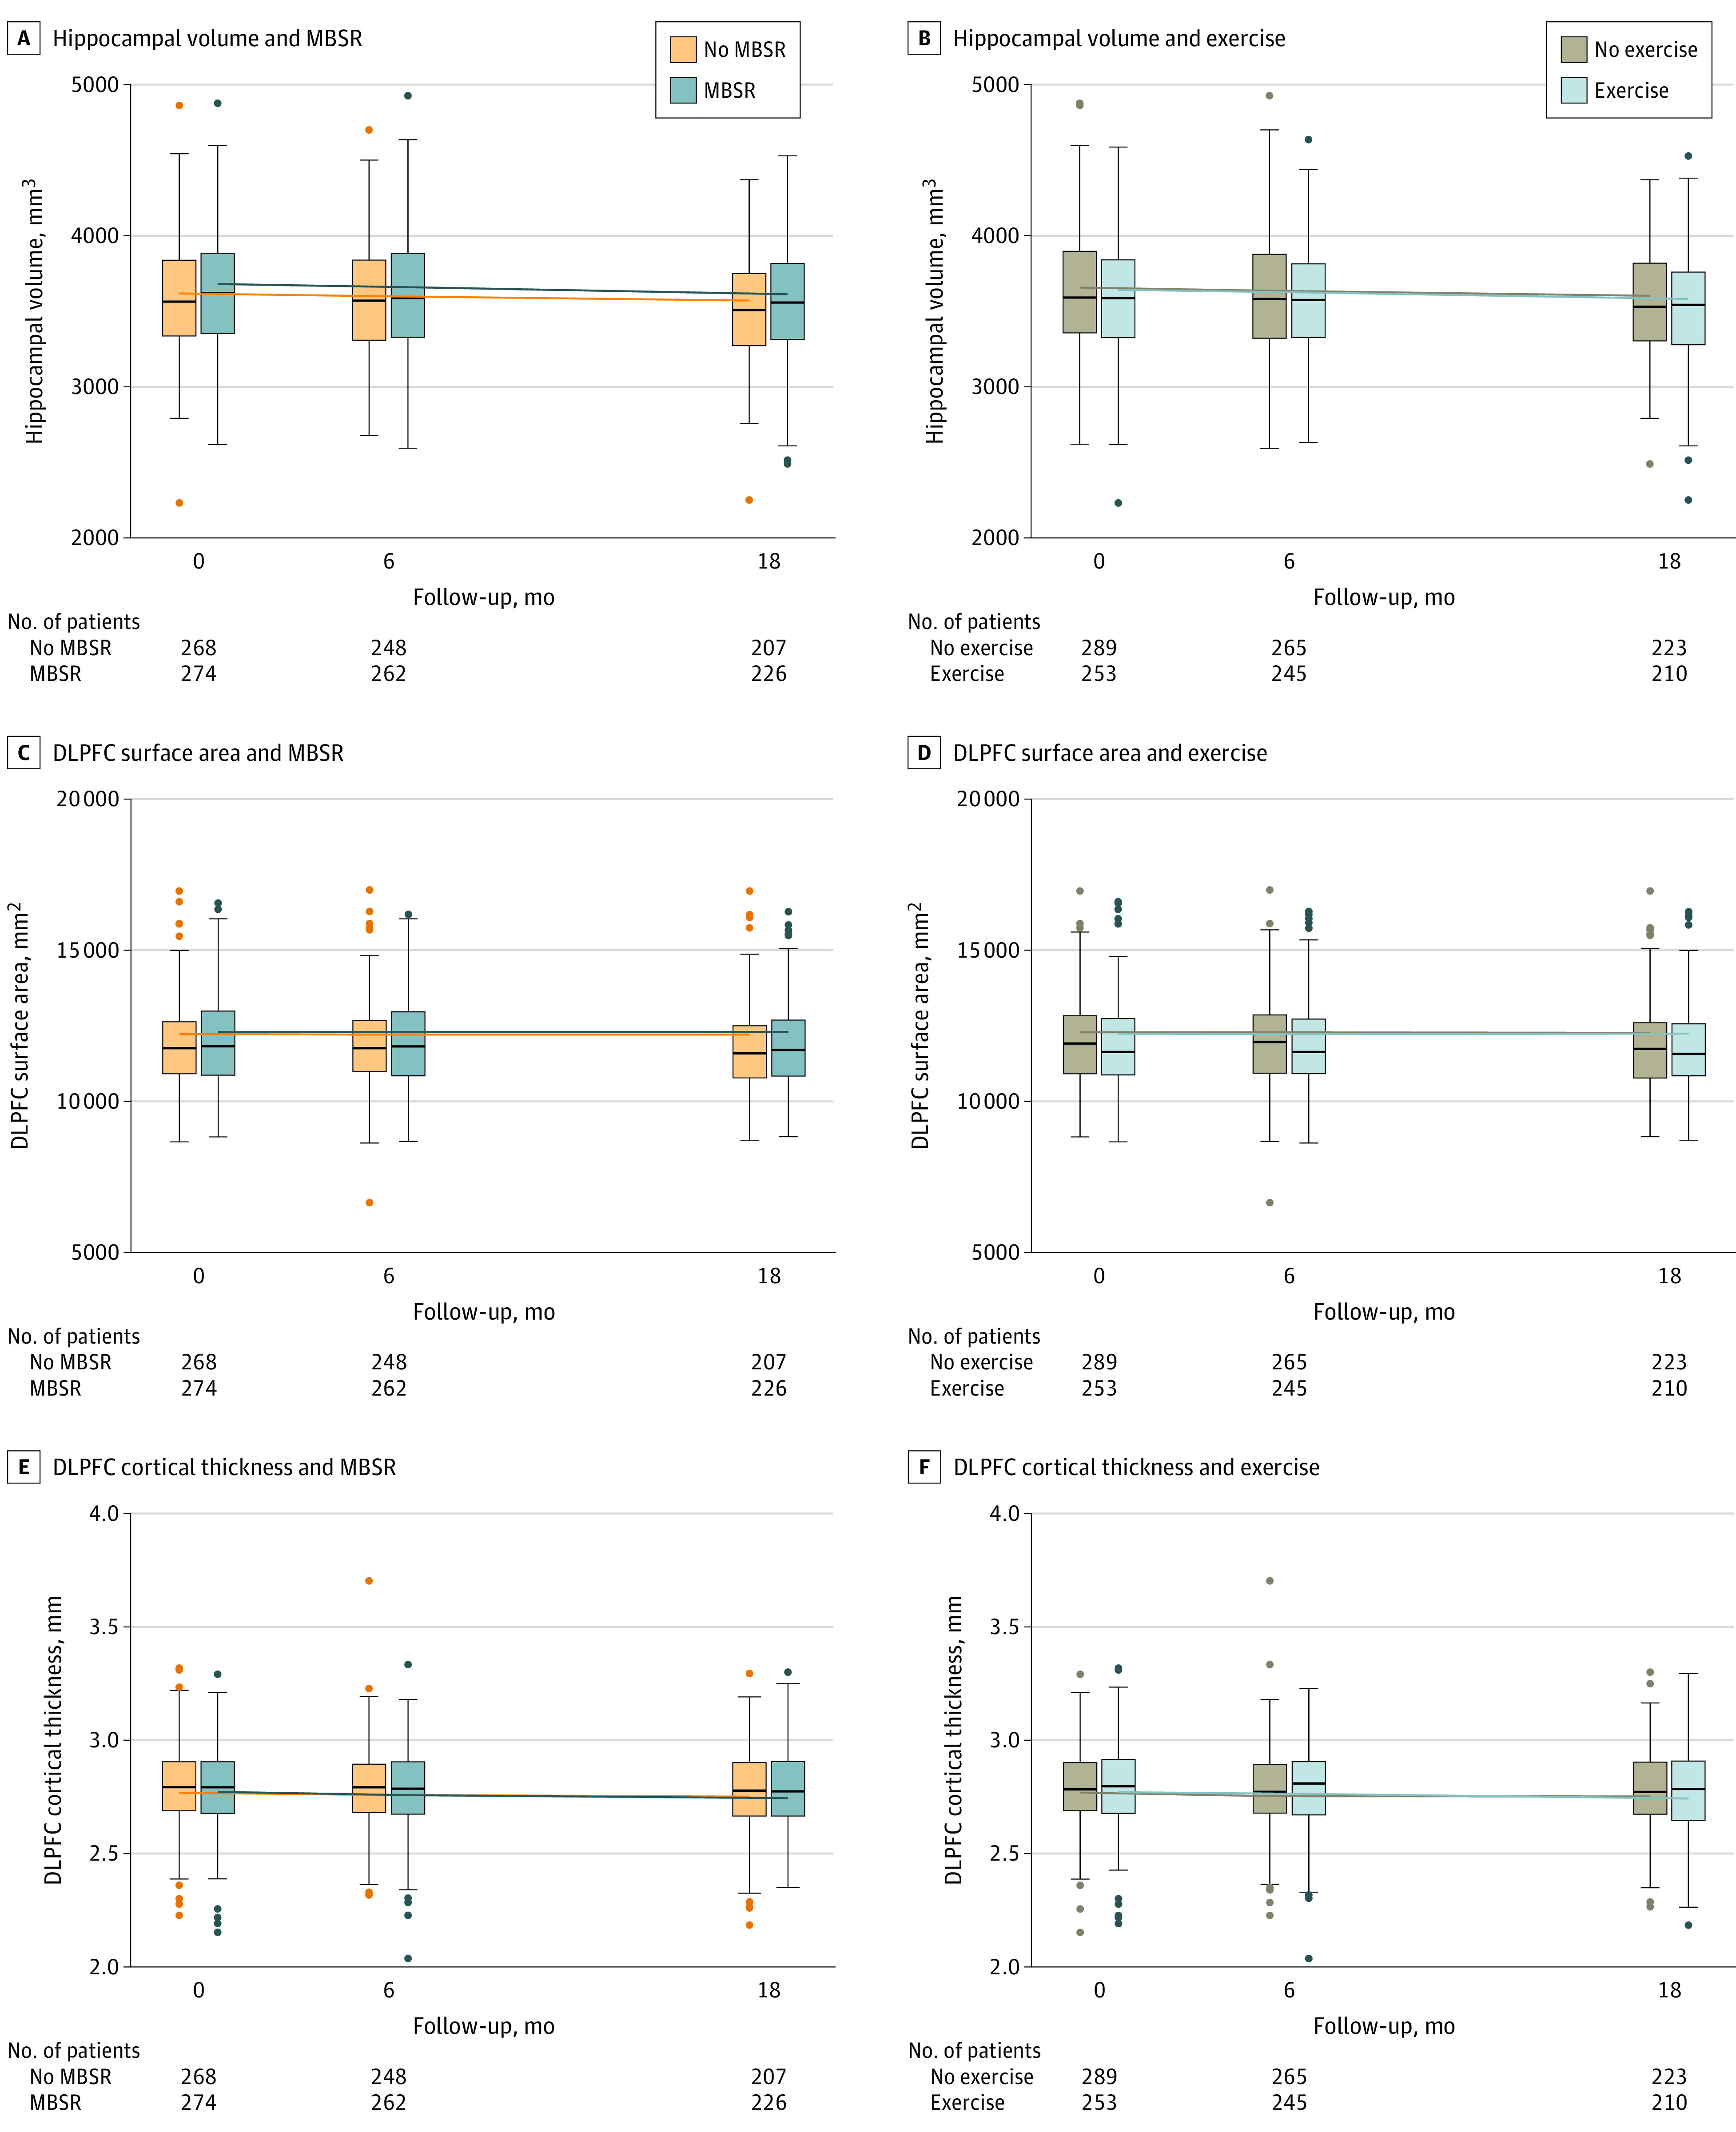
Figure 3. Structural Brain Changes Over 18 Months.

Shown are the mean of the right- and left-sided brain structures. The volumes of the brain regions in this article are somewhat dependent on the measurement technique; existing literature has found that both the volumes and their rate of change are consistent with studies in healthy aging. For example, Fraser et al37 found a rate of hippocampal atrophy of approximately 1% per year and Frangou et al38 reported a frontal cortical thickness change of 0.005 mm per year. These are within the range of changes reported in the current sample. The ranges for hippocampal volume, DLPFC surface area, and DLPFC cortical thickness are 2232 to 4926; 6642 to 16 992; and 2.0 to 3.7, respectively. See eTable 2 in Supplement 2 for numerical/model data of intervention effects. The boxplot inner horizontal lines represent the median values, the boxes represent the IQR (25% and 75%), the vertical whiskers extend to the upper and lower adjacent values (the furthest points within 1.5 IQRs of the 25th and 75th percentiles), and the dots indicate outlier values.
