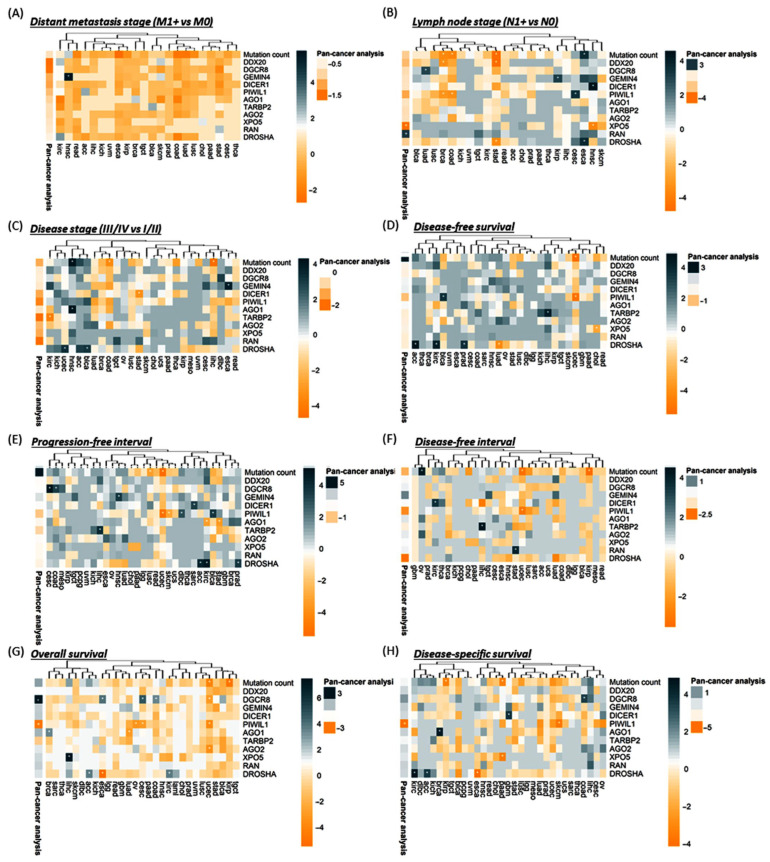
Figure 9.
miRNA machinery gene mutations are potential prognosis markers in cancers. Heatmap representing the hierarchical clustering of the TCGA cancer types with the likelihood ratio p-values [Log(p-value)] obtained after logistic (for clinical parameters) and Cox (for outcome parameters) regression analyses between gene mutants/mutation count and clinical or survival parameters. The sign of Log(p-value) follows the sign of the regression beta-coefficient exponential. Annotation represents similar logistic regression in the pan-cancer study. * representing significant (p < 0.05) logistic/Cox regressions.

