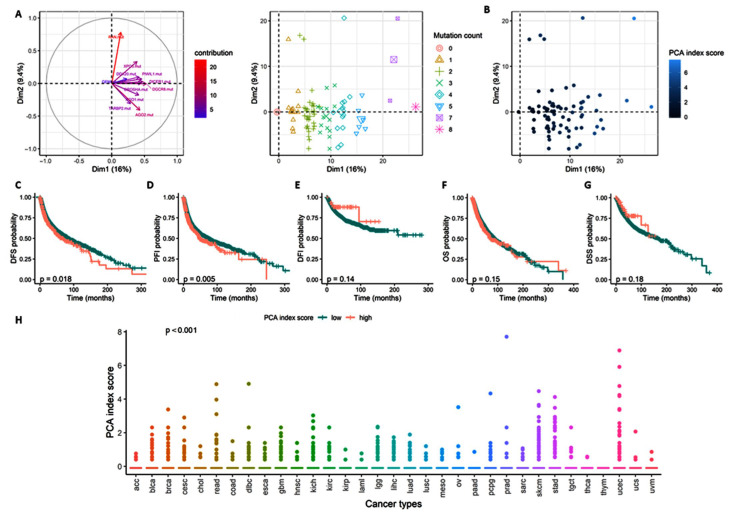
Figure 10.
Principal Component Analysis using miRNA machinery gene mutations differentiated cancer samples. (A) Principal Component Analysis of the pan-cancer study according to the 11 gene mutants with the variable (left) and individual (right) plots, samples stratified according to the mutation count. (B) PCA individual plots are colored according to the PCA index score. (C–G) Kaplan–Meier curve estimated for the PCA index score according to DFS (E), PFI (D), DFI (E), OS (F), and DSS (G). Log test p-value. (H) PCA index score distribution across the cancer type. Kruskal test p-value. Significant p-value < 0.05. DFI, Disease-free interval; DFS, Disease-free survival; DSS, Disease-specific survival; OS, Overall survival; PFI, Progression-free interval.

