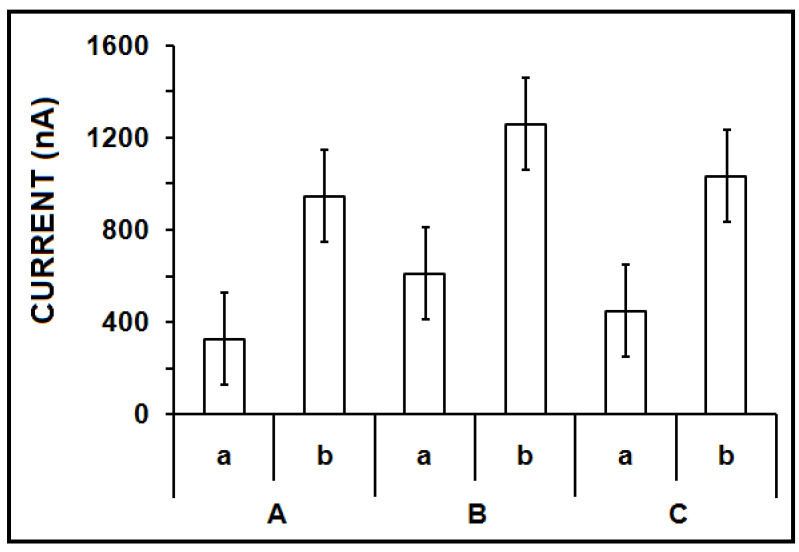
Figure 3.
The effect of the temperature on the hybridization between DNA or ZNA probe and miR-34a target. Bar graphs representing the average guanine signals (n = 3) obtained after hybridization of (a) DNA probe with miR-34a target, (b) ZNA probe with miR-34a target at (A) 25 °C, (B) 50 °C, and (C) 75 °C hybridization temperature.

