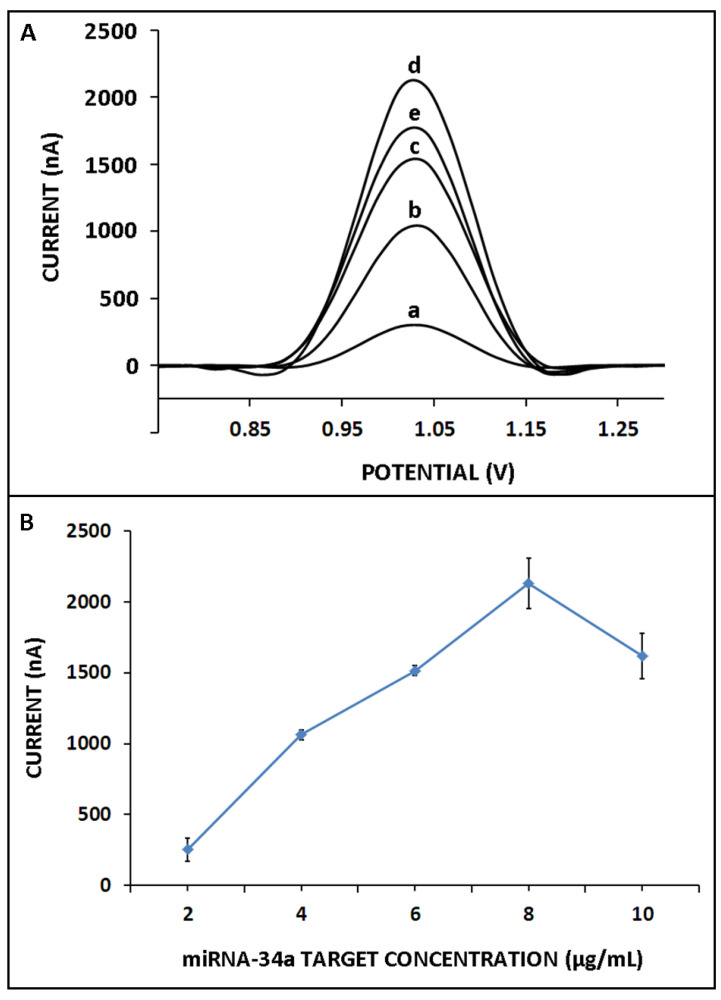
Figure 5.
The effect of miR-34a target concentration on the hybridization efficiency: (A) voltammograms representing the guanine oxidation signal in case of hybridization between 4 µg/mL ZNA probe and (a) 2, (b) 4, (c) 6, (d) 8, and (e) 10 µg/mL miR-34a target; (B) line graph based on average guanine signals that measured after hybridization of 4 µg/mL miR-34a ZNA probe with miR-34a RNA target.

